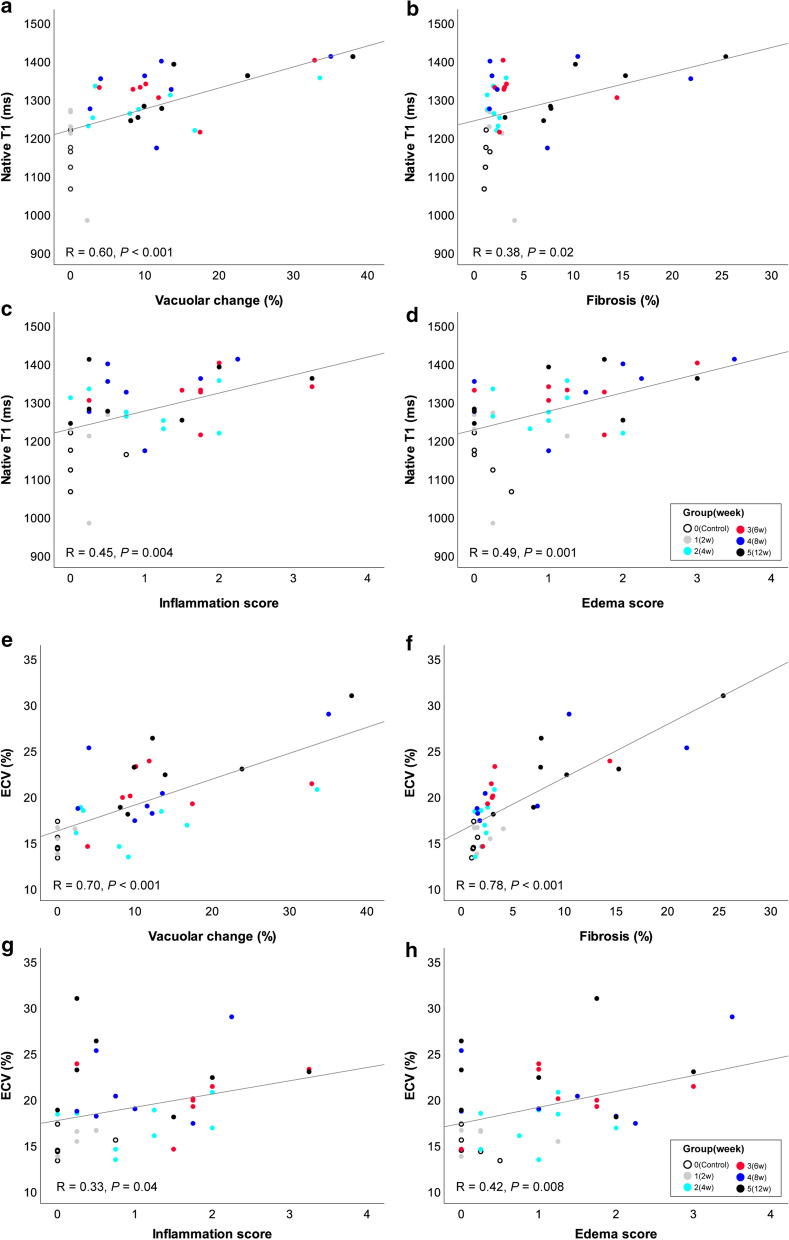
Fig. 4.
Univariable regression analysis between native T1 or ECV and histopathological findings. Groups 1 (2 week), gray circle; 2 (4 week), emerald circle; 3 (6 week), red circle; 4 (8 week), blue circle; and 5 (12 week), black circle indicates the subjects undergoing 2, 4, 6, 8, and 12 weeks of treatment. Group 0 (control), open circle indicates the control subjects. a–d The native T1 value showed significant association with the vacuolar change (a, R = 0.60, P < 0.001), fibrosis (b, R = 0.38, P = 0.02), inflammation score (c, R = 0.45, P = 0.004), and myocardial edema score (d, R = 0.49, P = 0.001). e–h ECV value showed significant association with the vacuolar change (e, R = 0.70, P < 0.001), fibrosis (f, R = 0.78, P < 0.001), inflammation score (g, R = 0.33, P = 0.04), and myocardial edema score (h, R = 0.42, P = 0.008)

