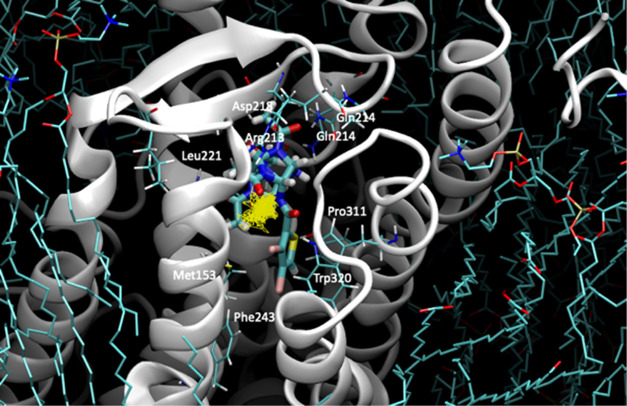
Figure 3.
Molecular representation of the last frame of the 200 ns molecular dynamic simulation of thiowurtzine in complex with the model of the mu opioid receptor. Thiowurtzine is displayed as thick sticks, the mu receptor as gray ribbons, and the lipids as cyan sticks. The trajectory of the thiowurtzine mass center throughout the entire simulation is displayed as yellow lines. The side chains of the residues interacting with thiowurtzine are displayed as sticks, and their name and number are indicated on the structure.

