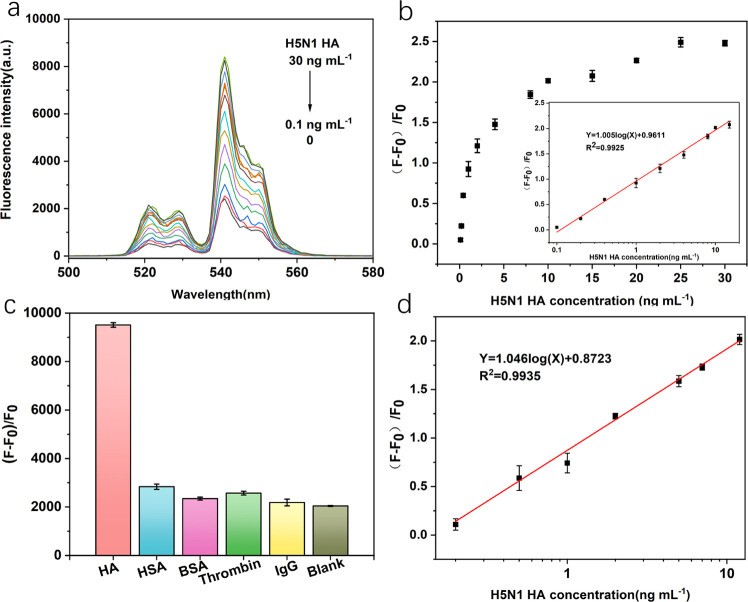
Figure 6.
(a) Upconversion emission spectra of the UCNP aptasensor in the presence of various concentrations of H5N1 HA (0, 0.1, 0.2, 0.4, 1, 2, 4, 8, 10, 15, 20, 25, 30 ng mL–1) under optimal experimental conditions, where F0 represents the fluorescence intensity of the UCNP-Apt–GO complex (0.05 mg mL–1 UCNP-Apt and 0.1 mg mL–1 GO) and F is the fluorescence intensity of the complex plus different concentrations of HA. (b) Relationship between relative fluorescence intensity (F – F0)/F0 at 541 nm against the H5N1 HA concentration. Inset: linear part of the plot ranging from 0.01 to 15 ng mL–1 in borate buffer. (c) Specific selectivity evaluation of the proposed method for HA (20 ng mL–1) against other proteins (100 ng mL–1). (d) Relationship curve of relative fluorescence intensity for added standard HA from human serum samples. It shows the linear response with HA concentrations from 0.2 to 12 ng mL–1, under the experimental conditions the same as an aqueous buffer. Error bars: SD, n = 3.

