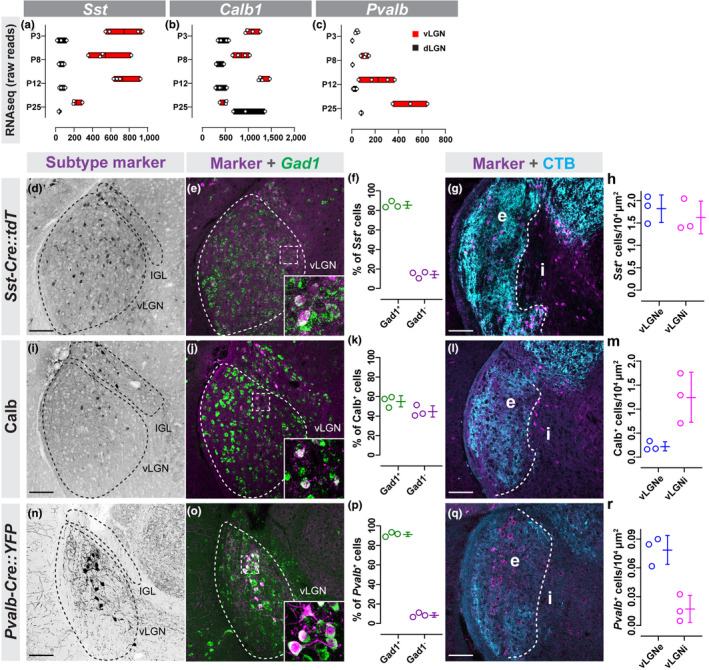
FIGURE 2.

Canonical markers of GABAergic neurons label subsets of neurons in vLGN. (a–c) Raw transcript reads Sst (a), Calb1 (b), and Pvalb (c) mRNA in vLGN and dLGN obtained by RNAseq. Individual data points plotted as white circles, min/max values are confined to the red bars, and vertical black line with bars depicts mean. (d) Transgenic labeling of Sst + neurons in vLGN of P60 Sst‐Cre::Rosa‐Stop‐tdT mice. (e) In situ hybridization (ISH) for Gad1 mRNA in Sst‐Cre::Rosa‐Stop‐tdT vLGN. (f) Quantification of the percentage of Sst + cells that co‐express Gad1 mRNA. Data points represent biological replicates, bars represent mean ± SD. (g) Transgenic labeling of Sst + neurons in vLGNe and vLGNi of Sst‐Cre:Rosa‐Stop‐tdT mice following intravitreal cholera toxin subunit b (CTB) injection. (h) Quantification of the density of transgenically labeled Sst + cells in vLGNe and vLGNi. Data plotted as in (f). (i) Immunolabeling of Calb+ cells in P60 vLGN. (j) IHC‐ISH for Calb protein and Gad1 mRNA. (k) Quantification of Calb+ and Gad1 + signal colocalization as seen in (j). Data plotted as in (f). (l) Calb+ neurons in vLGNe and vLGNi visualized by Calb‐immunolabeling and intravitreal CTB injection. (m) Quantification of the density of Calb‐immunoreactive cells in vLGNe or vLGNi. Data plotted as in (f). (n) Transgenic labeling of Pvalb + neurons in P60 vLGN of P60 Pvalb‐Cre::Thy1‐Stop‐YFP mice. (o) ISH for Gad1 mRNA in Pvalb‐Cre::Thy1‐Stop‐YFP vLGN. (p) Quantification of the percentage of Pvalb + cells that co‐express Gad1 mRNA. Data plotted as in (f). (q) Immunolabeling of Pvalb+ neurons in vLGNe and vLGNi of wild‐type mouse following intravitreal CTB injection. (r) Quantification of the density of Pvalb+ cells density in vLGNe and vLGNi. Data plotted as in (f). n = 3 animals in all data presented. All scale bars = 100 µm
