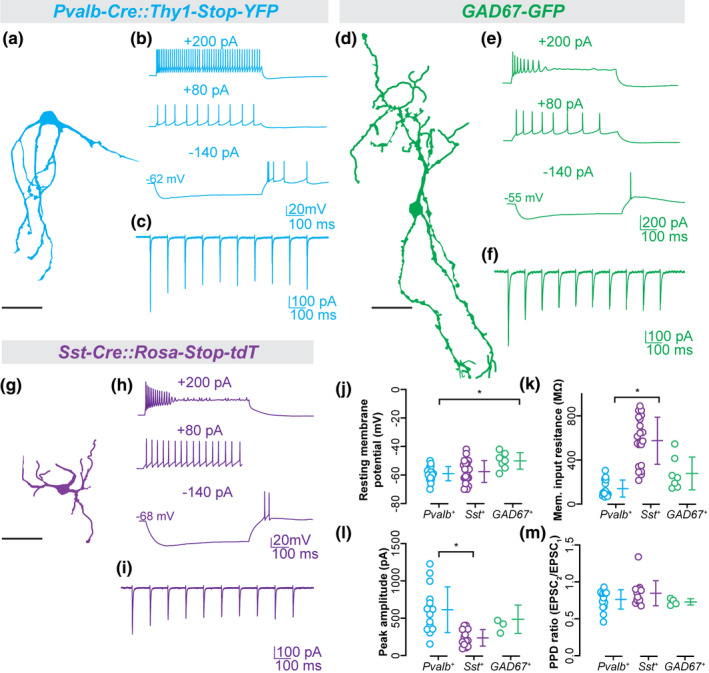
FIGURE 7.

Morphology, synaptic responses, and membrane properties of GABAergic subtypes in vLGNe. (a–i) Representative confocal reconstructions of Pvalb+ (a), GAD67+ (d), and Sst+ (g) neurons along with examples of their voltage responses to hyperpolarizing and depolarizing current pulses (top), and synaptic responses to optic tract (OT) stimulation (bottom). (j) Plot depicting resting membrane potential of Pvalb+ (n = 18 cells), Sst+ (n = 22 cells), and GAD67+ neurons (n = 7 cells). (k) Plot depicting membrane input resistance of Pvalb+ (n = 18 cells), Sst+ (n = 22 cells), and GAD67+ neurons (n = 7 cells). (l) Plot depicting peak excitatory post‐synaptic currents (EPSC) amplitude of Pvalb+ (n = 15 cells), Sst+ (n = 13 cells), and GAD67+ neurons (n = 4 cells). (m) Plot depicting paired pulse depression ratio (PPD) during repeated stimulation of Pvalb+ (n = 15 cells), Sst+ (n = 13 cells), and GAD67+ neurons (n = 4 cells). Each data point represents an individual value and bars reflect mean ± SEM. Asterisks and bars indicate statistically significant (p < .05) determined by a Kruskal–Wallis test with Dunn's correction for multiple comparisons. All scale bars = 50 µm
