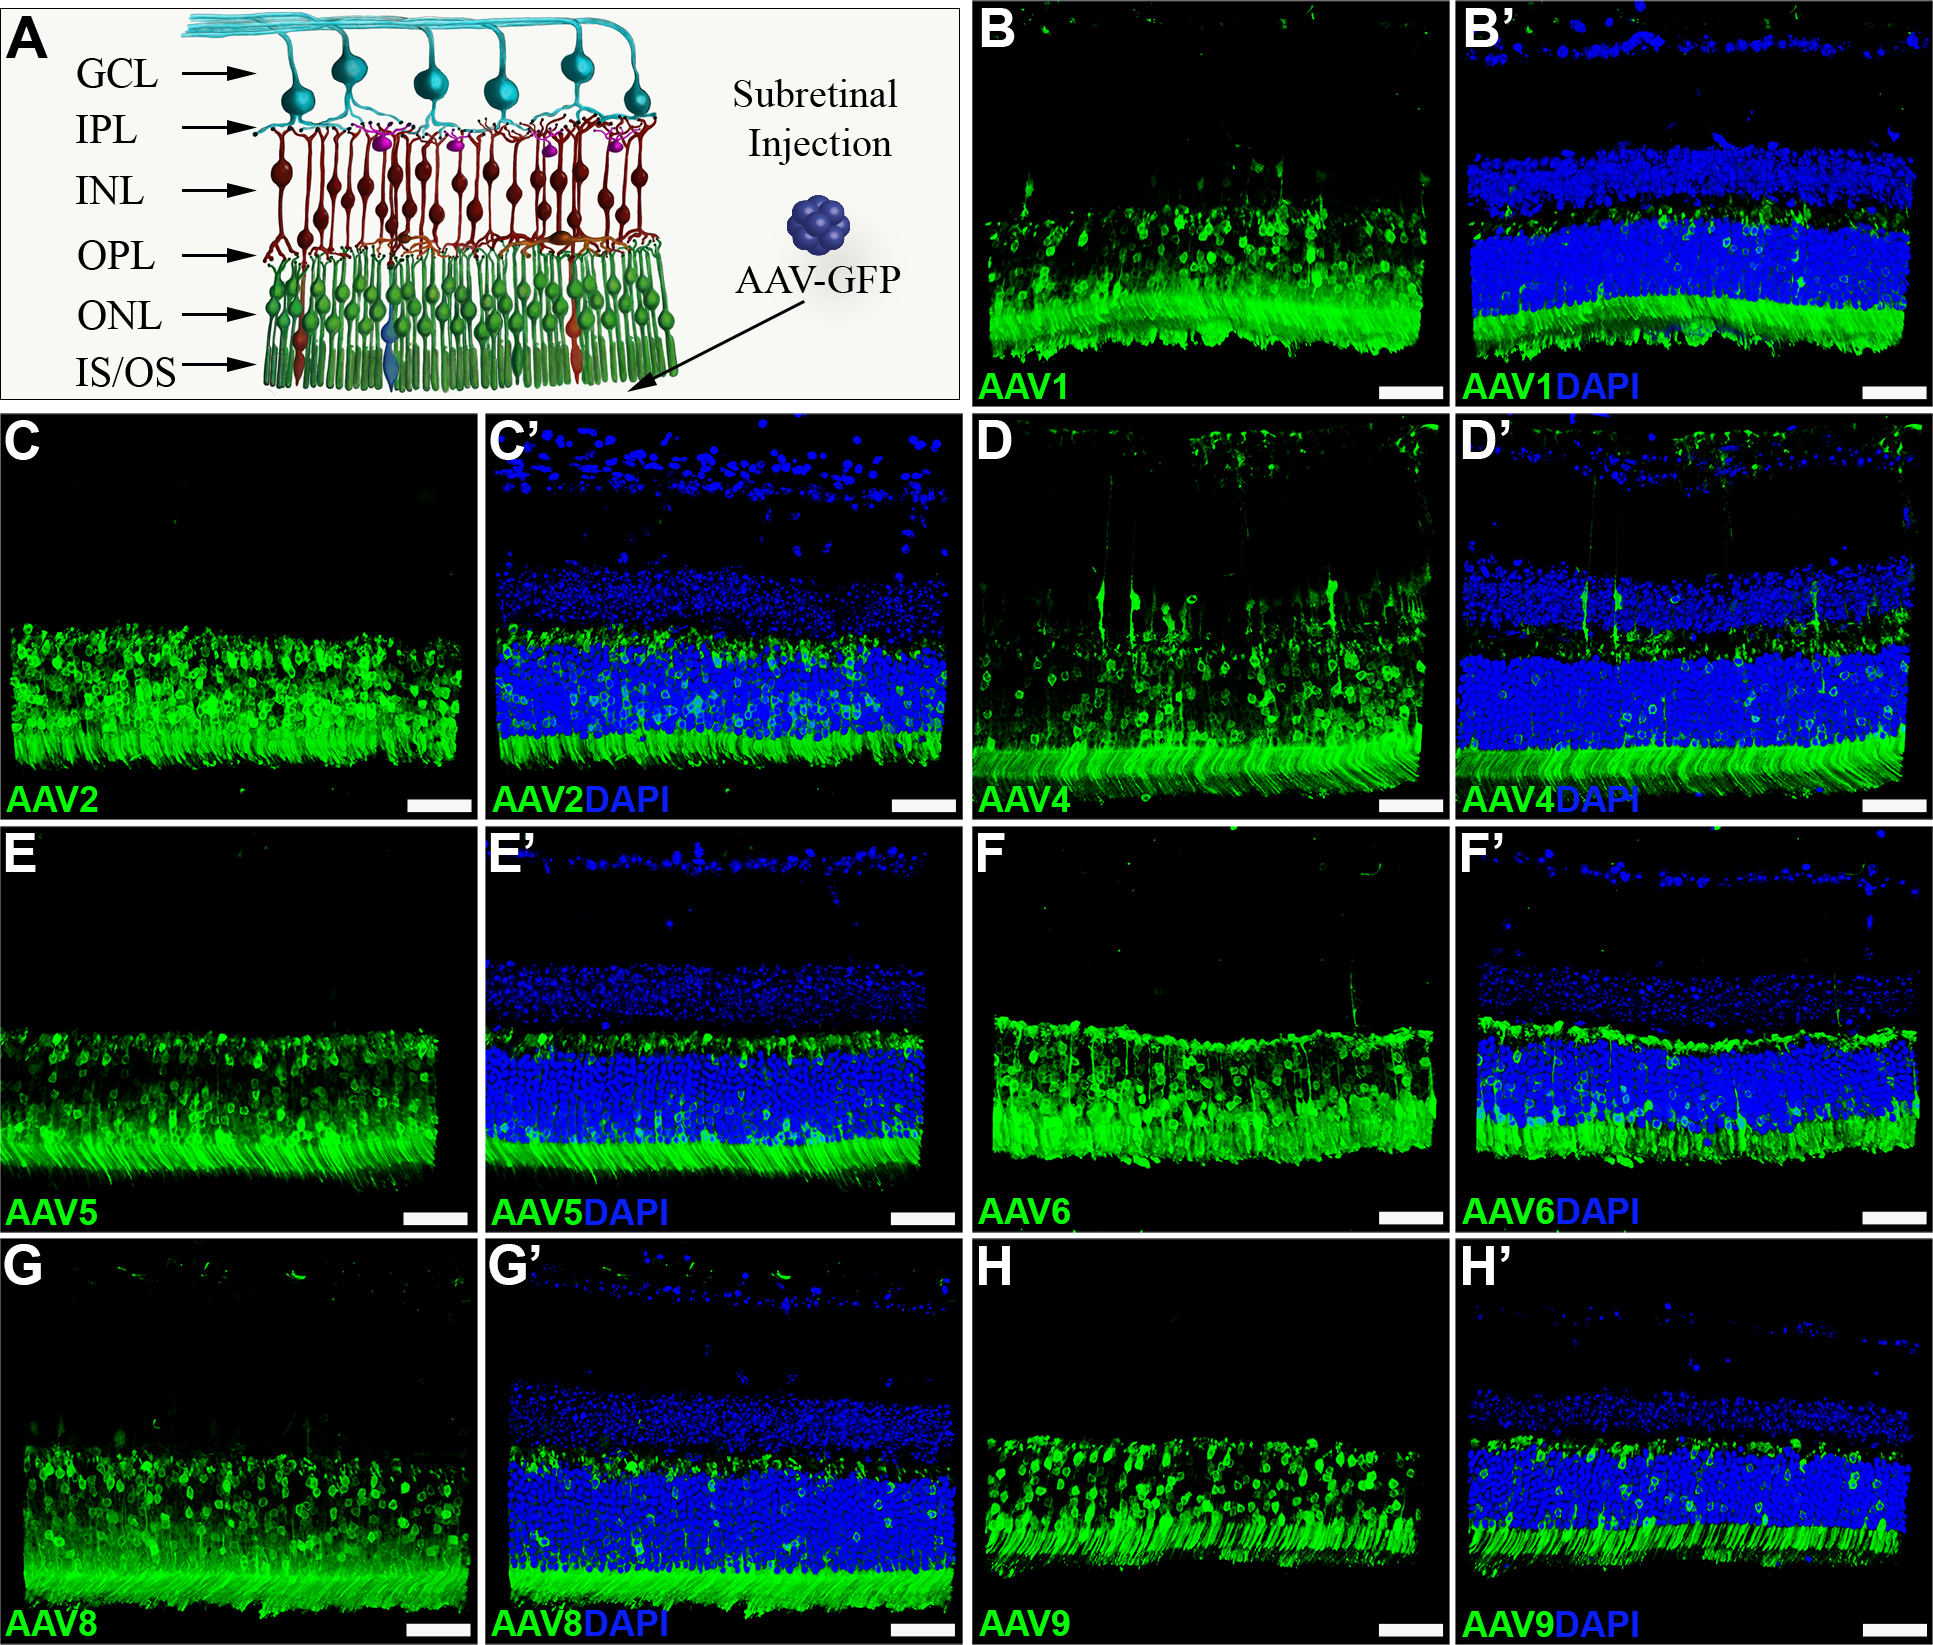
Figure 2. AAV serotype transduction comparison following subretinal injection in mouse retina.

A) Schematic digram depicting the layers of the neural retinal and placement of AAV vectors in vivo. B-H) Immunohistochemical analysis of GFP expression (green) driven by seven different AAV serotypes two weeks post-subretinal injection. Representative z-stacks are shown for each of AAV1 (B-B’), AAV2 (C-C’), AAV4 (D-D’), AAV5 (E-E’), AAV6 (F-F’), AAV8 (G-G’) and AAV9 (H-H’). DAPI was used to visualize retinal nuclei. NFL – nerve fiber layer, GCL – ganglion cell layer, IPL – inner plexiform layer, INL – inner nuclear layer, OPL – outer plexiform layer, ONL – outer nuclear layer, IS/OS – photoreceptor cell inner and outer segments. Scale bars = 50 μm.
