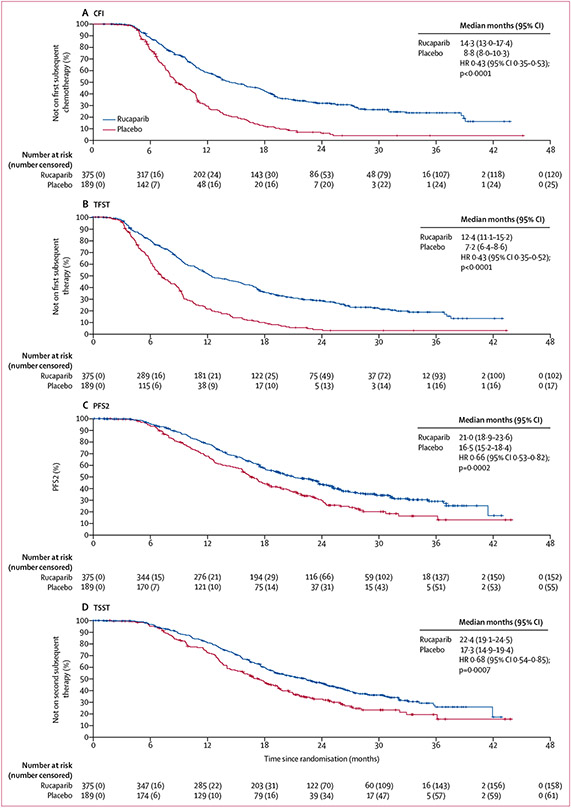
Figure 2: Kaplan–Meier estimates of CFI, TFST, PFS2, and TSST in the ITT population.
The ITT population consisted of 375 patients in the rucaparib group and 189 patients in the placebo group. CFI=chemotherapy-free interval. HR=hazard ratio. ITT=intention to treat. PFS2=time to disease progression on subsequent therapy or death. TFST=time to start of first subsequent therapy. TSST=time to start of second subsequent therapy.

