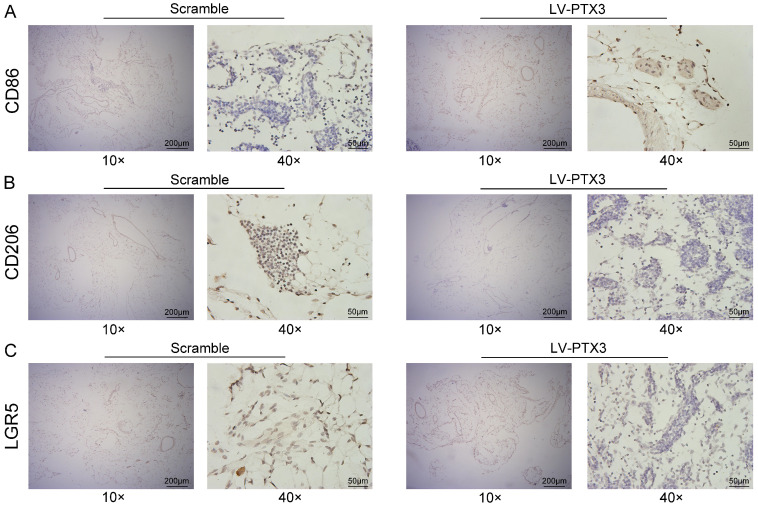
Figure 6.
PTX3 suppresses the expression of LGR5 and M2 polarization of macrophages in milky spots in vivo. (A, B, C) Representative images of CD86, CD206 and LGR5 expression level of greater omentum were shown by immunohistochemistry (IHC) between the groups of Scramble and LV-PTX3 (Scale bars: 200 μm and 50 μm).

