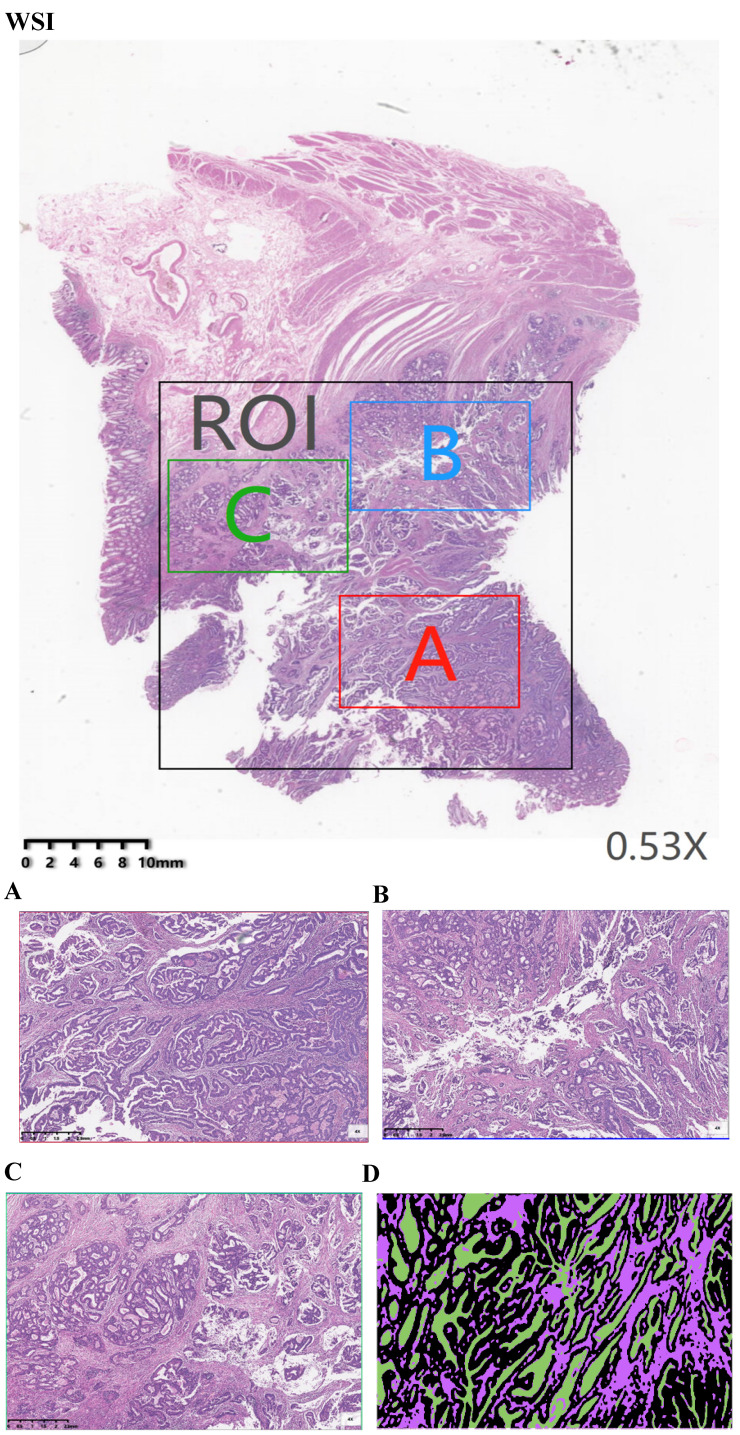
Figure 1.
Example of a manual assessment at the tumor level. (WSI) Pathology signature construction in hematoxylin and eosin stained whole slide images. ROI, Area was annotated by a pathologist highlighting the region of interest. (A) Red annotation is the most invasive part. (B) Blue annotation. (C) Green annotation. (D) images were annotated using Black-tumor, Purple-stroma and Green-necrosis. A: red annotation, is the most invasive part; B: blue annotation; C: green annotation; Black: tumor; Purple: stroma; Green: necrosis.

