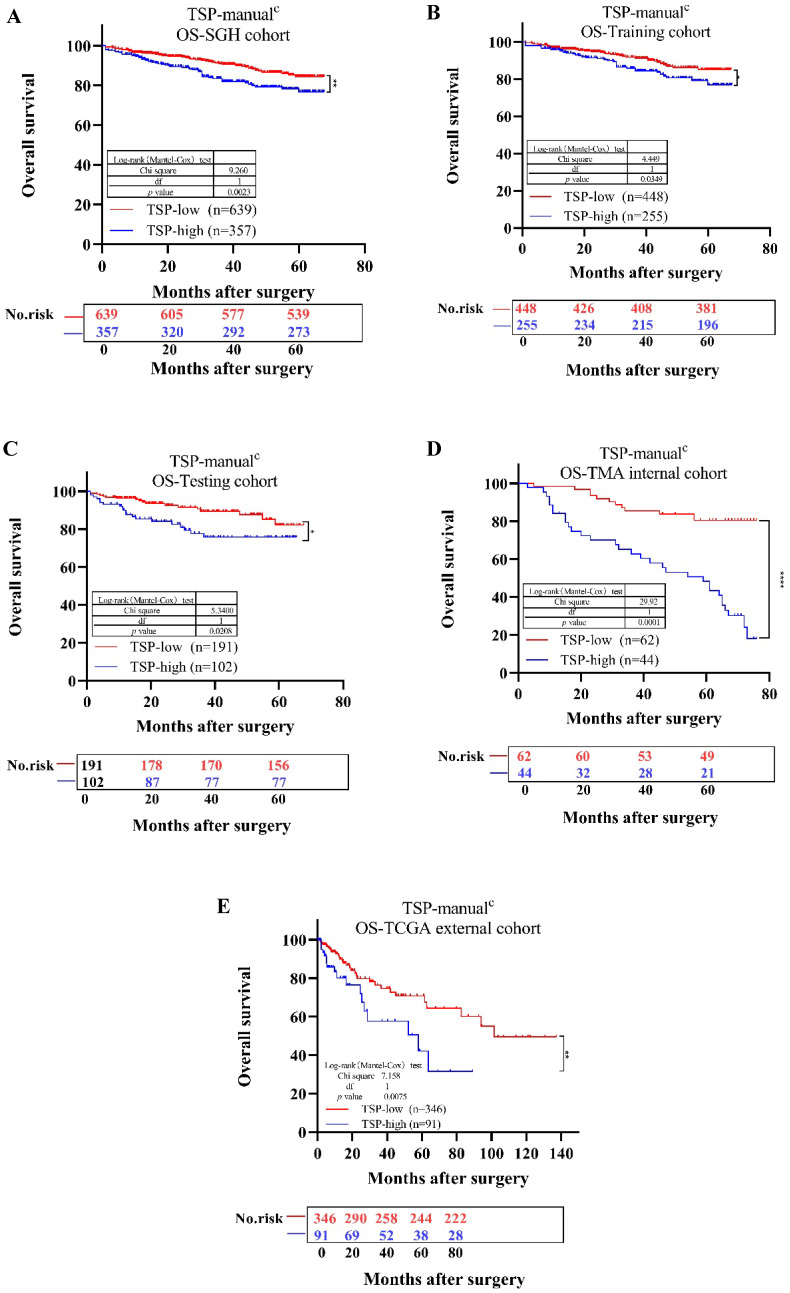
Figure 5.
Kaplan-Meier survival analysis for overall survival of TSP-low verse TSP-high. Results for SGH cohort (A), Training cohort (B), Testing cohort (C), TMA internal cohort (D), TCGA external cohort (E) according to the TSP classifier stratified by clinicopathological risk factors. P-values were calculated by log-rank test.

