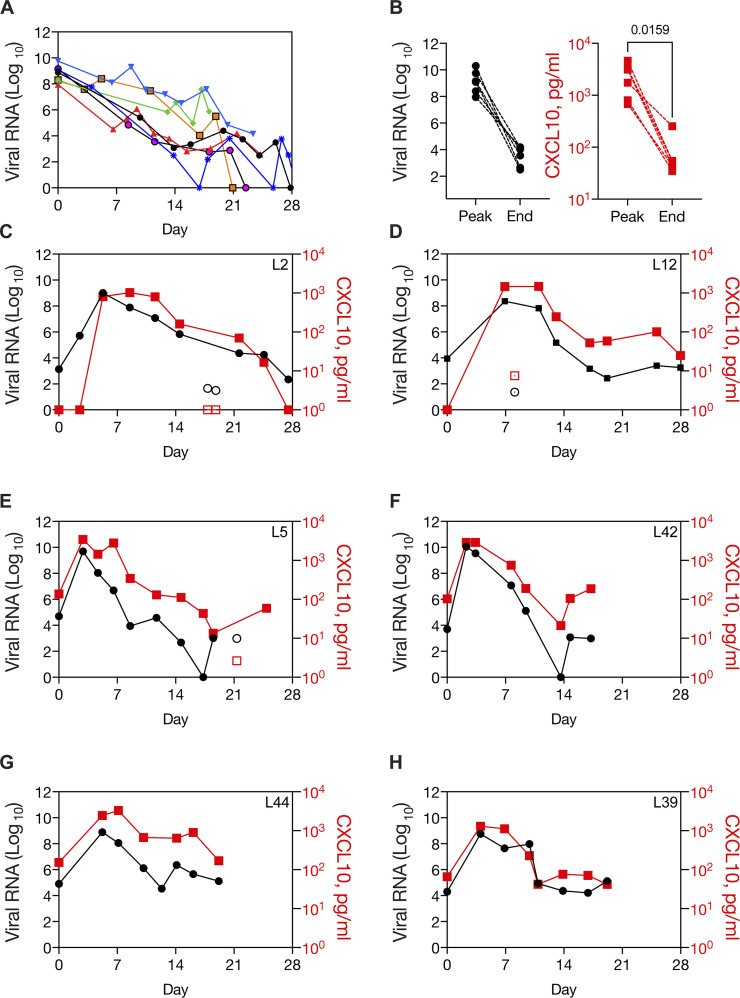
Figure 3.
Dynamic innate immune response to SARS-CoV-2 in the nasopharynx in patients diagnosed before peak viral load. Related to Fig. S3 and Table S7. (A) Viral load over time in longitudinal samples from seven patients with high viral load in the first sample (Ct N1 > 20). (B) Paired viral RNA and NP CXCL10 measurements at the peak viral load and at the end viral load, defined as the first sample with Ct N1 > 30, for six patients shown in G (data not available for one sample). CXCL10 level was significantly different in peak and end samples by paired t test. (C–H) Viral load and NP CXCL10 level in longitudinal samples from SARS-CoV-2–positive patients who presented with a low viral load (Ct N1 > 28) that increased to a high viral load (Ct N1 < 20). Viral load is expressed as FC from the limit of detection for the SARS-CoV-2 N1 gene (black circles) and CXCL10 is expressed as picograms per milliliter in the NP swab–associated viral transport medium (red squares). Samples with low levels of RNaseP, an indicator of sample quality, are shown with open symbols. Patient characteristics are described in Table S7.

