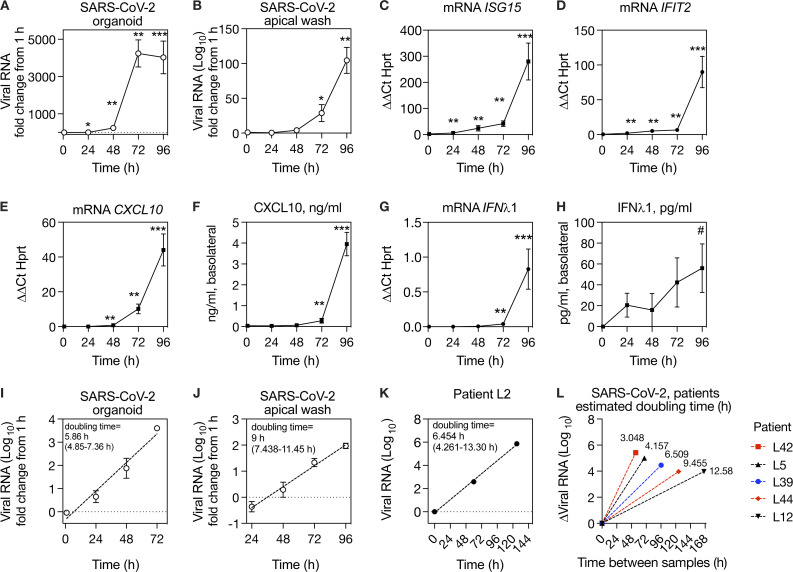
Figure 4.
Kinetics of SARS-CoV-2 replication in organoids and in vivo.(A and B) Time course of SARS-CoV-2 replication in human primary airway epithelial organoids, expressed as fold increase from 1 h (postinoculation time point). (C–E) ISG mRNA level relative to HPRT mRNA in organoids during SARS-CoV-2 infection. (F) CXCL10 protein in the basolateral medium during SARS-CoV-2 replication. (G) IFNλ1 mRNA level relative to HPRT in organoids during SARS-CoV-2 infection. (H) IFNλ1 protein in the basolateral medium during SARS-CoV-2 infection. (I) Exponential curve fit for increase in SARS-CoV-2 RNA in organoids from 1 to 72 h and calculated doubling time for exponential growth, based on data also shown in A, with 95% CI. (J) Exponential curve fit for increase in SARS-CoV-2 RNA shed from apical surface from 24 to 96 h and calculated doubling time for exponential growth, based on data also shown in B, with 95% CI. (K) Exponential curve fit for increase in viral RNA during SARS-CoV-2 replication for first three virus-positive samples from patient L2 and calculated doubling time for exponential growth with 95% CI. (L) Estimated doubling times for increase in viral RNA during SARS-CoV-2 replication in patients with one SARS-CoV-2–positive sample before peak viral load, shown in Fig 3, D–H. The y axis shows change in viral RNA, and the x axis shows time interval between samples. Doubling time calculation assumes exponential growth between first and peak viral load samples. For A–J, symbols show mean and SEM of four to six biological replicates per condition, and data are representative of two independent experiments with primary epithelial cells from different donors. For K and L, data from six individual patients are shown (one patient in K and five patients in L). Symbols indicate significant difference from the t = 1 h after inoculation time point by Mann–Whitney test (*, P = 0.0317; #, P = 0.0152; **, P = 0.0079; ***, P = 0.0043).

