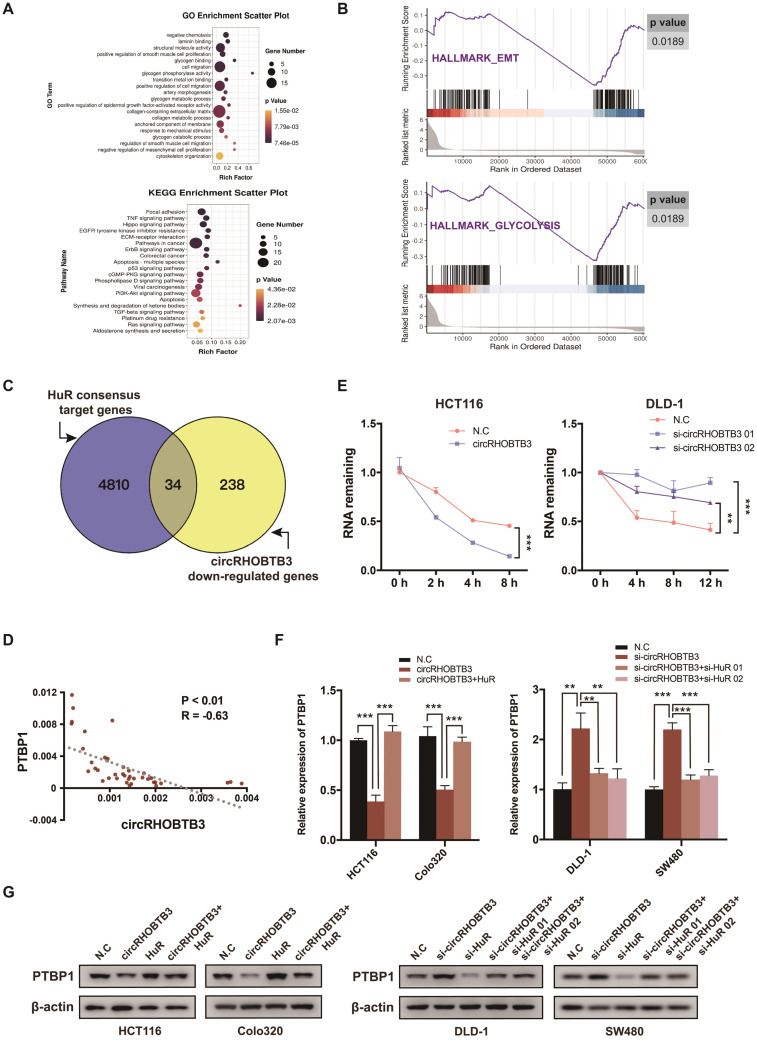
Figure 4.
CircRHOBTB3 degrades HuR to inhibit the expression of PTBP1. (A) Bulb map of GO and KEGG analyses of the differentially expressed mRNAs in HCT116 cells transfected with N.C and circRHOBTB3 overexpression plasmids. (B) GSEA analyses showing the enrichment of genes in EMT and glycolysis. (C) Venn diagram exhibiting overlapping circRHOBTB3-repressed genes in the set of HuR targets determined by the previous CLIP experiment. (D) qRT-PCR showed a negative correlation between circRHOBTB3 and PTBP1 expression in 40 CRC tissues. The R values and P values were from Pearson's correlation analysis. (E) qRT-PCR estimated the influences of circRHOBTB3 on the mRNA stability of PTBP1 in HCT116 and DLD-1 cells treated with actinomycin D. The P values were determined by two-way ANOVA. (F and G) qRT-PCR and Western blotting analyses were adopted to test the expression of PTBP1 in N.C and circRHOBTB3-overexpressing HCT116 and Colo320 cells with or without HuR overexpression (left); qRT-PCR and Western blotting analyses showed the expression of PTBP1 in N.C and circRHOBTB3-knockdown DLD-1 and SW480 cells with or without HuR knockdown (right). The data are presented as the mean ± SD of three independent experiments, two-tailed Student's t-tests, *p < 0.05, **p < 0.01 and ***p < 0.001.

