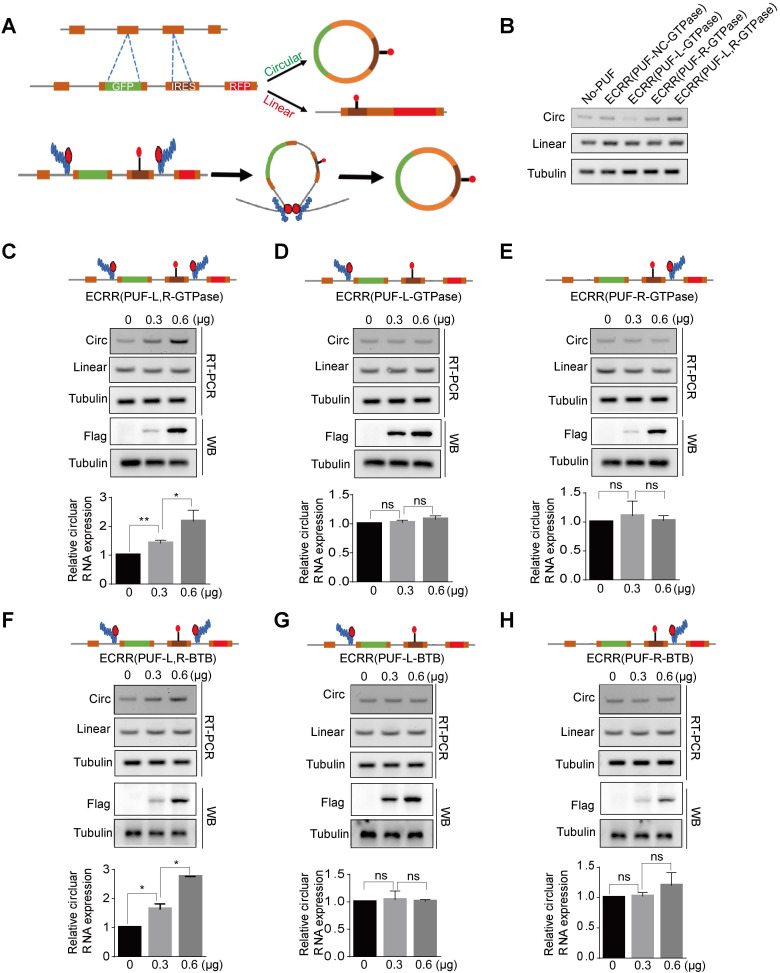
Figure 4.
ECRRs stimulate the circular RNA production of the circScreen minigene reporter. (A) The schematic diagrams of how ECRRs regulate the circular RNA biogenesis of the circScreen minigene reporter. (B) The effects of different ECRRs on the circular RNA production of circScreen reporter were examined with RT-PCR. The representative gel figures were shown. (C) The fixed amount of the circScreen reporter was co-transfected with increased amounts of ECRR (PUF-L-GTPase) and ECRR (PUF-R-GTPase), whose PUF domains recognized both the upstream and downstream target sequences simultaneously, into 293T cells. (D) The fixed amount of the circScreen reporter was co-transfected with increased amounts of ECRR (PUF-L-GTPase), whose PUF only recognized the upstream target sequence in the reporter, into 293T cells. (E) The fixed amount of the circScreen reporter was co-transfected with increased amounts of ECRR (PUF-R-GTPase), whose PUF only recognized the downstream target sequence in the reporter, into 293T cells. For (C-E), the resulting cells were harvested 48 hours after transfection, and total RNAs were isolated for RT-PCR to examine the level of circular and linear RNA. (F) The fixed amount of the circScreen reporter was co-transfected with increased amounts of ECRR (PUF-L-BTB) and ECRR (PUF-R-BTB), whose PUF domains recognized both the upstream and downstream target sequences simultaneously, into 293T cells. (G) The fixed amount of the circScreen reporter was co-transfected with increased amounts of ECRR (PUF-L-BTB), whose PUF only recognized the upstream target sequence in the reporter, into 293T cells. (H) The fixed amount of the circScreen reporter was co-transfected with increased amounts of ECRR (PUF-R-BTB), whose PUF only recognized the downstream target sequence in the reporter, into 293T cells. For panels (F-H), the resulting cells were harvested 48 hours after transfection, and total RNAs were isolated for RT-PCR to examine the level of circular and linear RNA. The representative gel figure was shown. The densities of signals were determined by densitometry and three experiments were carried out with mean +/- SD of relative fold change of circular RNA expression plotted. The protein level of FLAG was also measured with a western blot assay.

