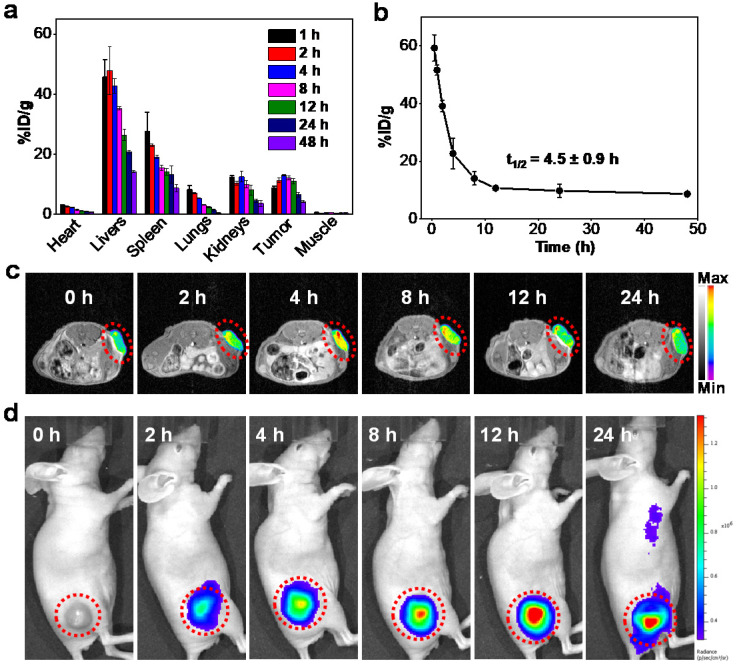
Figure 3.
(A) Biodistribution of Mn-ZGGOs in major organs and tumors after intravenous administration at various time intervals (1, 2, 4, 8, 12, 24, and 48 h). The Mn-ZGGOs concentrations were normalized as the percentage of the injected dose of Mn element per gram of each organ (%ID g-1). (B) Time course of blood levels of Mn-ZGGOs levels following intravenous injection. The half-life time (t1/2) was calculated to be 4.5 ± 0.9 h. (C) In vivo T1-weighted MR images of mice injected intravenously with Mn-ZGGOs. (D) In vivo XEPL imaging of tumor-bearing mice after intravenous injection of Mn-ZGGOs.

