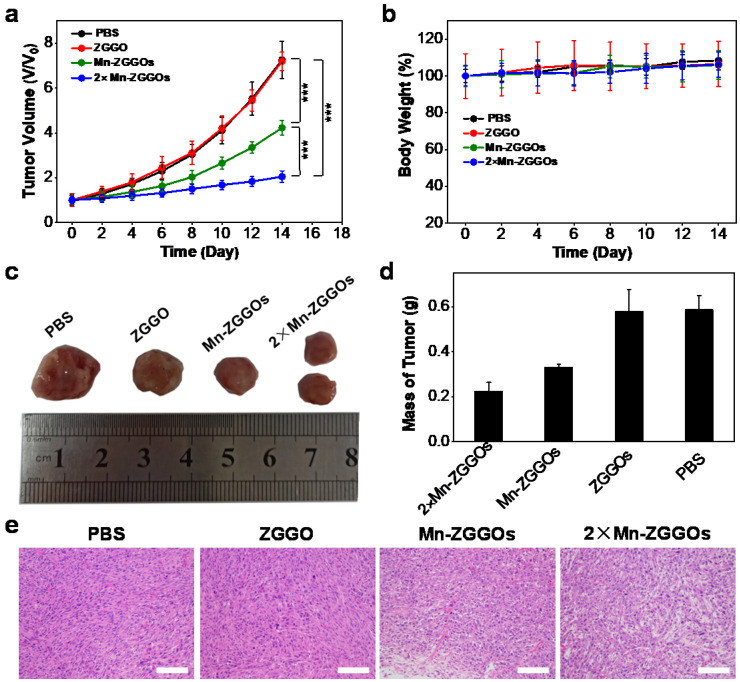
Figure 4.
(A) Tumor volume curves and (B) Body weight growth curves of four groups of U87MG tumor-bearing mice at 14 days after intravenous injection with different formulations. Error bars are based on mean ± standard deviation (n = 5), ***P<0.001. (C) Typical photographs of excised tumors at day 14 after different treatments. (D) Relative tumor mass after different treatments on day 14. (E) H&E staining of tumor tissues after different treatments on day 14. Scale bar: 50 μm.

