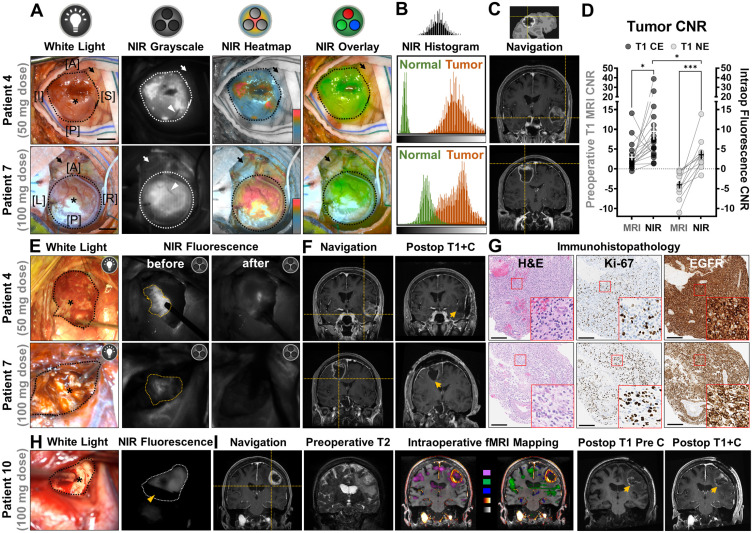
Figure 2.
Intraoperative NIR fluorescence imaging of high-grade gliomas enhanced tumor contrast against normal brain in patients infused with either low (50 mg) or high (100 mg) dose of panitumumab-IRDye800. (A) Exposed tumors in the surgical field under white light and NIR fluorescence (in grayscale, heatmap and overlay modes, taken with hand-held imager). Dotted outlines: tumor margin; arrows: peritumoral brain tissue; arrowheads: blood vessels feeding into the tumors; asterisks: interrogation sites for neuronavigation. [A]: anterior; [P]: posterior; [I]: inferior; [S]: superior; [L]: left; [R]: right; Scale bars = 1 cm. (B) Histogram of NIR fluorescence (quantified from intraop NIR grayscale images) in tumor and peritumoral normal brain tissue. X-axis: pixel fluorescence intensity (range: 0 - 255); Y-axis: pixel count (range: 0 - 5000). (C) Neuronavigation coordinates (crosshairs) on presurgical contrast-enhanced MR images corresponding to interrogation sites in the surgical field. (D) Tumor contrast-to-noise ratio (CNR) improvement by intraoperative NIR imaging of tumor against peritumoral brain tissue, at interrogation sites within contrast enhancement (CE) and non-enhancing (NE) areas (right y-axis) compared to preoperative T1-weighted MRI scans of tumor against contralateral hemisphere white matter (left y-axis). Each symbol represents one intraoperative interrogation site. * P = 0.015 (CE MRI vs NIR), *** P = 0.0002 (NE MRI vs NIR) by paired t-tests and * P = 0.04 (CE vs NE NIR) by unpaired t-test. (E) Representative intraoperative white light photographs of resection cavities (black outlines) and corresponding open-field NIR fluorescence images (taken with hand-held imager) before and after removal of residual tumors (yellow outlines) to reach final wound bed. Asterisks: interrogation sites for neuronavigation. (F) Neuronavigation coordinates (crosshair) marking the location of the residual tumors on presurgical MR images and final wound bed (arrows) in post-operative contrast-enhanced MR image. (G) Pathological (H&E) and immunohistochemistry staining on residual tumor tissue against tumor proliferation marker, Ki-67, and EGFR. Insets: magnified bright-field microscopic views of cellular staining pattern. Scale bars = 200 µm. (H) Representative intraoperative white light photographs of wound bed (black outline) and corresponding open-field NIR fluorescence images (taken with surgical microscope) showing presence of residual tumor (white outline). Asterisks: interrogation sites for neuronavigation; yellow arrowhead: suction instrument for surface bleeding. (I) Neuronavigation coordinates (crosshair) marking the location of the residual tumors in the wound bed on presurgical MR images outside contrast-enhanced boundary in T1 MRI image. Edema and eloquent cortex involvement in peritumoral brain tissue on preoperative T2 image and fMRI mapping (Pink: visual responsive naming; green: tongue movement; blue: negative BOLD imaging signal; glow heatmap: T1+C; grayscale: pre-contrast T1), respectively. Postoperative T1 images of wound bed (arrows) before and after contrast injection.

