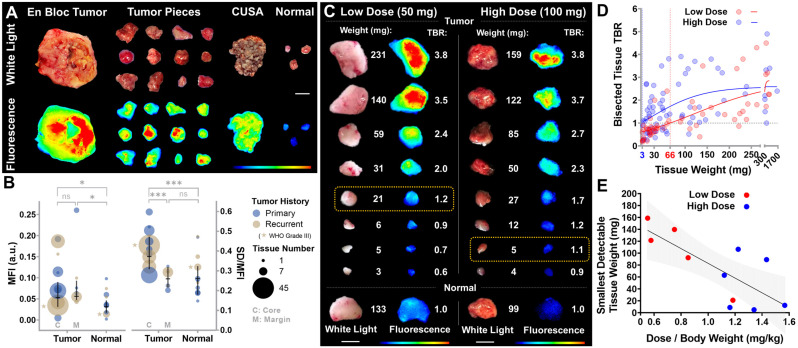
Figure 3.
Detection thresholds of intraoperative NIR fluorescence imaging ex vivo. (A) Intraoperative white light photographs and corresponding closed-field NIR fluorescence images of resected tissue. CUSA: cavitron ultrasonic surgical aspirator. Scale bar = 1 cm. (B) Average mean fluorescence intensity (MFI) and fluorescence heterogeneity (standard deviation normalized to mean fluorescence intensity) in tumor and normal tissue pieces. Each circle represents one patient. MFI: P = 0.7407 (C vs M), * P = 0.0364 (C vs Normal) and * P = 0.045 (M vs Normal); SD/MFI: *** P = 0.0003 (C vs M) and *** P = 0.0001 (C vs Normal) by ANOVA with multiple comparisons. (C) Postoperative white light photographs and corresponding closed-field NIR fluorescence images of serial bisected fresh tumor tissue ex vivo. Yellow boxes: smallest detectable tumor tissue in each dose cohort. Scale bars = 1 cm. (D) Target-to-background ratios (TBR) of resected tissue fluorescence is plotted against tissue weight of each dose cohort (each symbol represents one tumor piece). 3 mg and 66 mg: intersections of fitted curves with TBR = 1. (E) The smallest detectable tumor tissue weight correlated with body weight adjusted panitumumab-IRDye800 dose. P = 0.007 (each symbol represents one patient, simple linear regression goodness of fit: R2 = 0.57).

