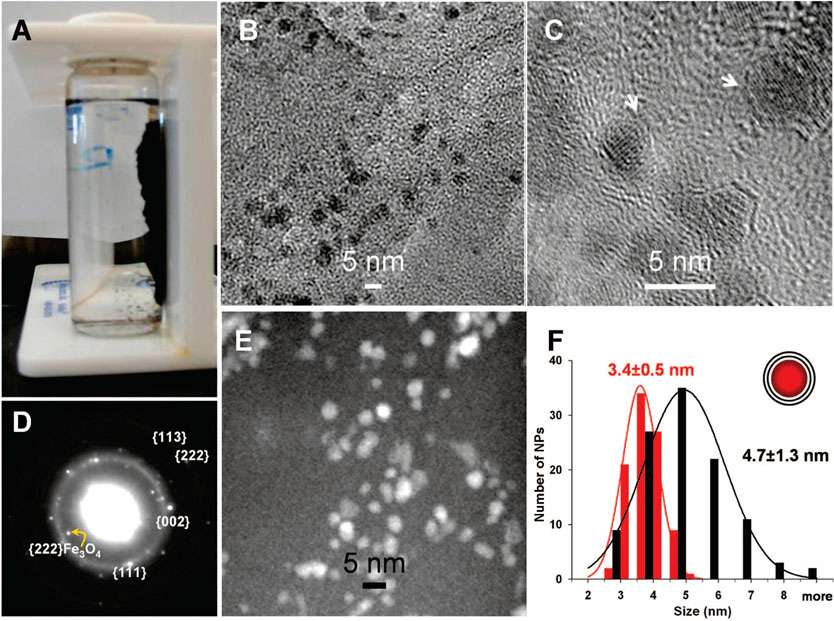
Figure 1.
Fe@C NPs. (A) Photograph showing suspended NPs (in ODCB) attracted to the wall of a glass vessel by a bar magnet. (B,C) Bright field TEM images of purified Fe@C NPs on a 3 nm thick carbon grid (B: low magnification; C: high magnification). (D) Electron diffraction pattern from ensemble of Fe@C NPs. The two dominant rings can be indexed by using a FCC-Fe lattice (a = 3.56 Å, d(111) = 2.05 Å, d(002) = 1.78 Å, d(113) = 1.07 Å, and d(222) = 1.03 Å). A small amount of Fe–Ox compounds, such as Fe3O4 (d(222) = 2.42 Å), are present as well. (E) STEM HAADF image. (F) Size distributions of the iron cores, determined from STEM, and the carbon shells, determined from bright field TEM. The size distributions follow Gaussian statistics. The diameter difference determined via the two modes corresponds to approximately two layers of carbon on the particles.

