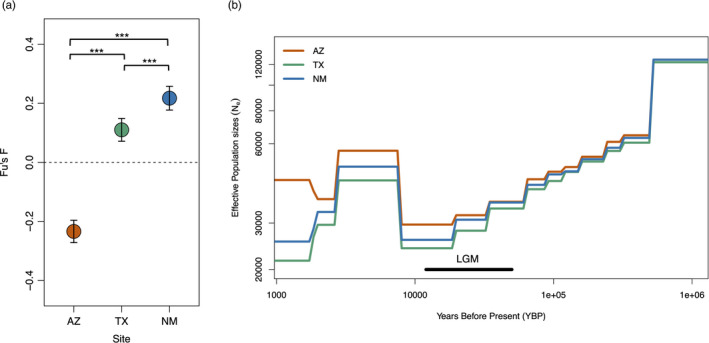
FIGURE 5.

(a) Population trends and (b) demographic histories of Montezuma quail. Population trends indicate that only the Arizona population(s) has been expanding (Fu's F < 0), whereas both Texas and New Mexico populations are declining (Fu's F > 0). Error bars indicate 95% CI around the estimate. The data indicate that Montezuma quail experienced a strong historic bottleneck during the last glacial maxima (LGM) followed by re‐expansion, and the similar demographic trajectories of each population prior to the LGM suggest that genomic differentiation (Figure 4) is relatively recent in origin
