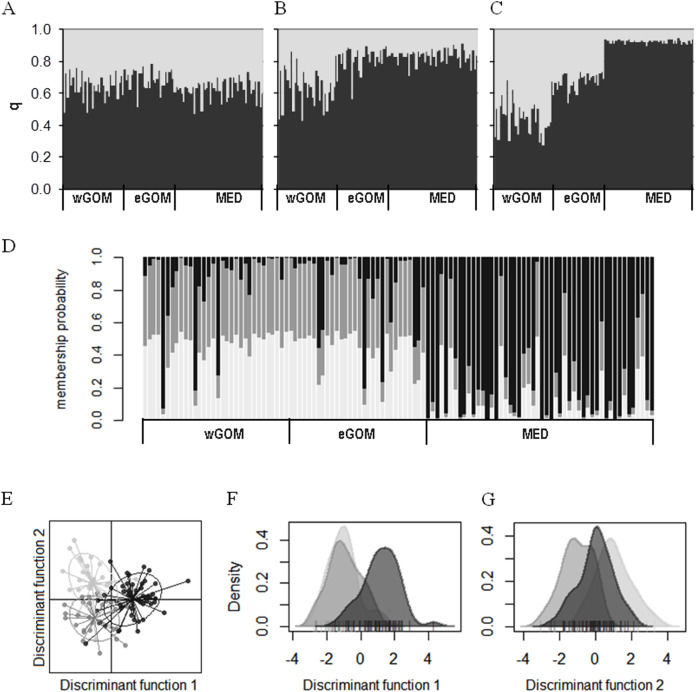
Figure 2. Clustering of ABFT larvae genetic diversity.
Genotypes at six microsatellite loci (Tth208, Tth1-31, Ttho7, Tth34, Ttho4 and Tth157) were used to characterize genetic diversity of ABFT larvae spawned in the MED (black), and GOM (grey). GOM can be segregated into wGOM (light grey) and eGOM (dark grey). (A–C) Bayesian clustering of ABFT larvae performed with STRUCTURE v2.3.4 (Pritchard, Stephens & Donnelly, 2000) software through admixture modeling considering prior information on ancestry from the collection area. For each larva the proportion of ancestry (q) for each of two population clusters is plotted considering prior ancestry information fitting 68% (A), 20% (B), or 12% of the data (C). (D) Discriminant Analysis of Principal Components (DAPC) performed with R package adegenet to show probability membership to three clusters through one discriminant function with an eigen value of 130.6 (40 principal components accumulating 0.925 variance). (E–G) Two discriminant functions obtained from DAPC (with eigen values of 64.72 and 29.34). Dot plot (E) and density plots (F, G) for each function are represented to illustrate overlapping of MED and GOM genetic diversity.

