
Figure 3.
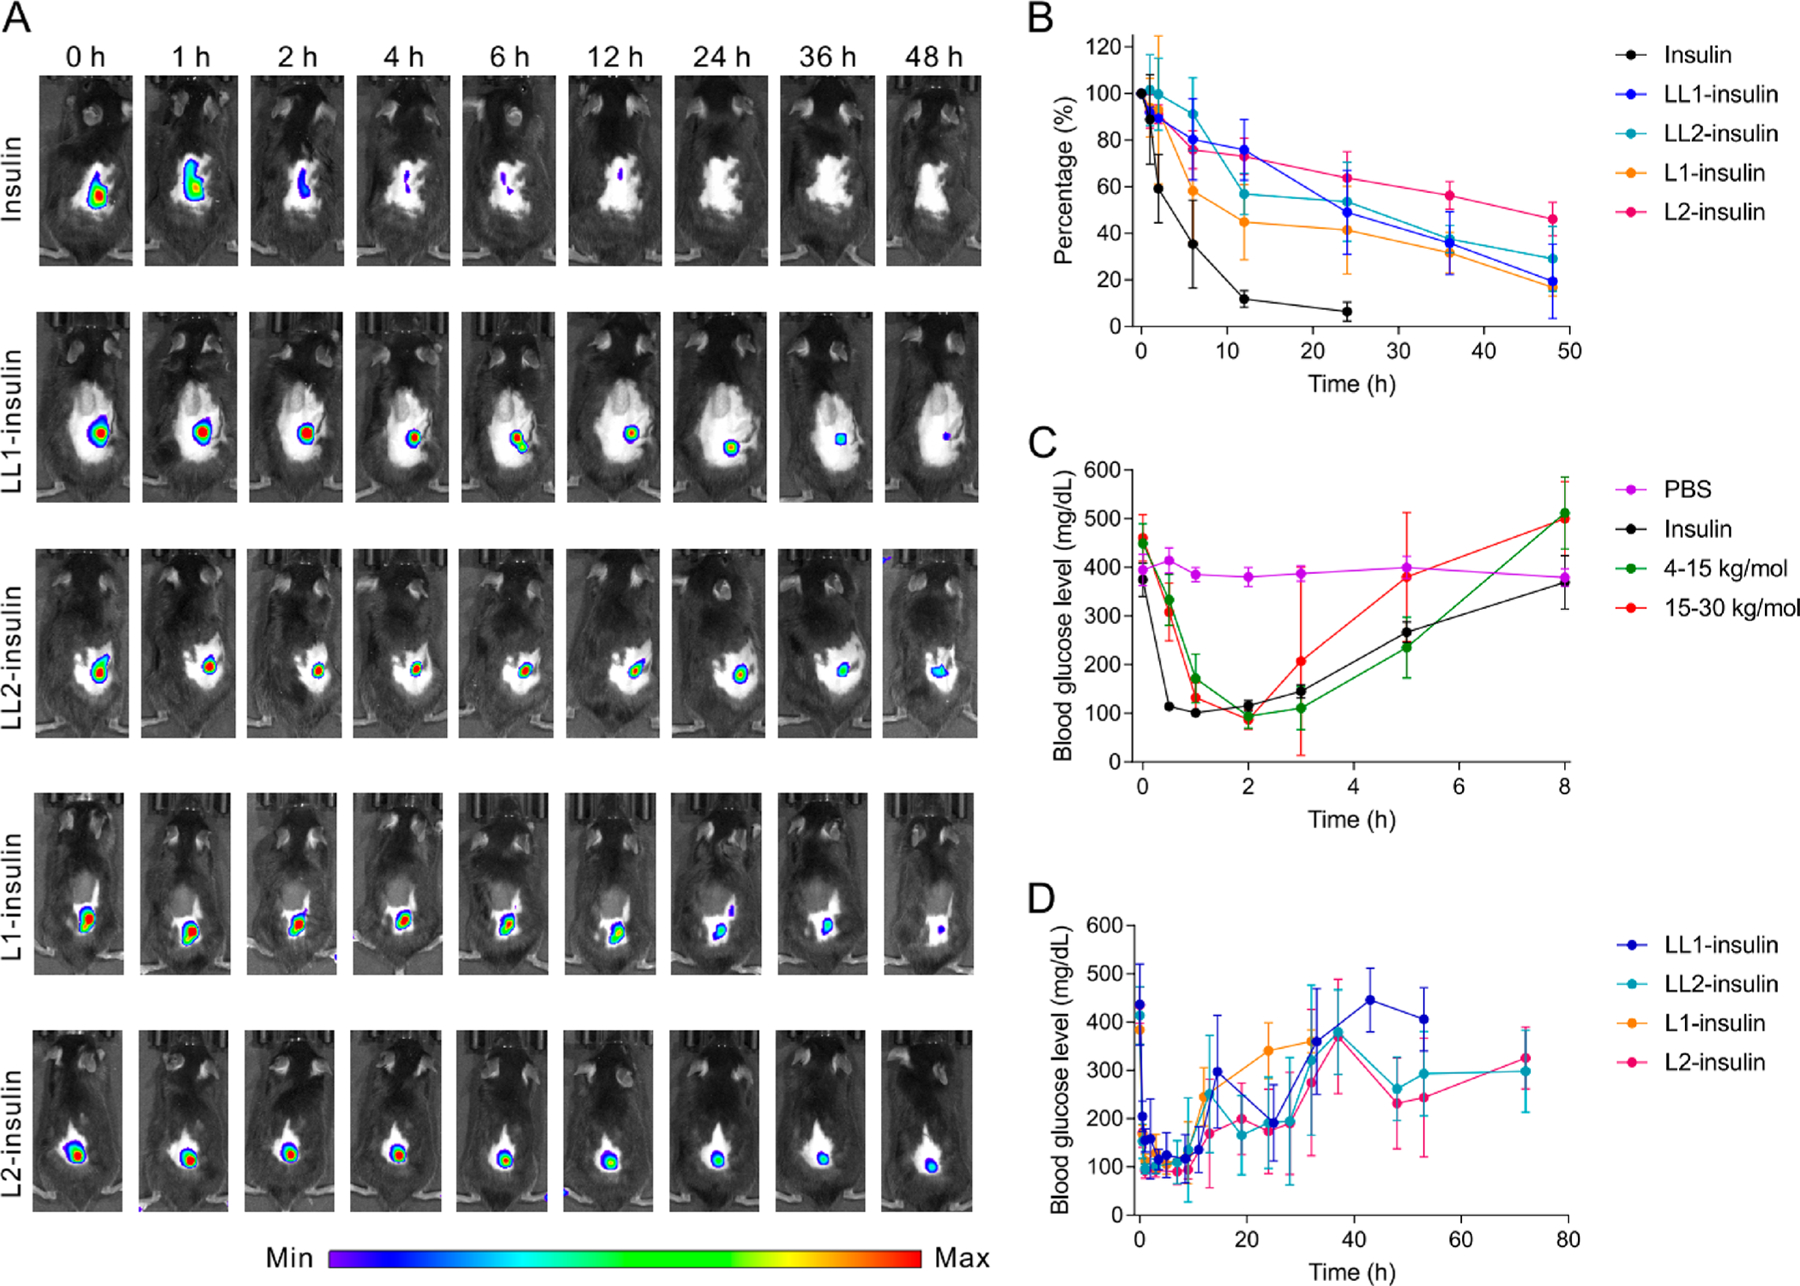
In vivo studies in type 1 diabetic mice. (A) Representative IVIS images of mice after treated with insulin and various insulin complexes. Insulin was labeled with Cy5. (B) Quantification of fluorescence intensity in (A). Data are mean ± SD (n = 3). (C) Blood glucose levels of diabetic mice treated with PBS, native insulin, and insulin complexes that were prepared from an equal weight of native insulin and PLL0.57-FPBA0.43 with the original PLL MW of 4–15 kg/mol or PLL0.6-FPBA0.4 with original PLL MW of 15–30 kg/mol. Data are mean ± SD (n = 5 to 10). (D) Blood glucose levels of diabetic mice treated with LL1-insulin, LL2-insulin, L1-insulin, and L2-insulin, with PLL having an original MW of 30–70 kg/mol. The insulin-equivalent dose was set to 1.5 mg/kg. Data are mean ± SD (n = 5 to 10).