
Figure 4.
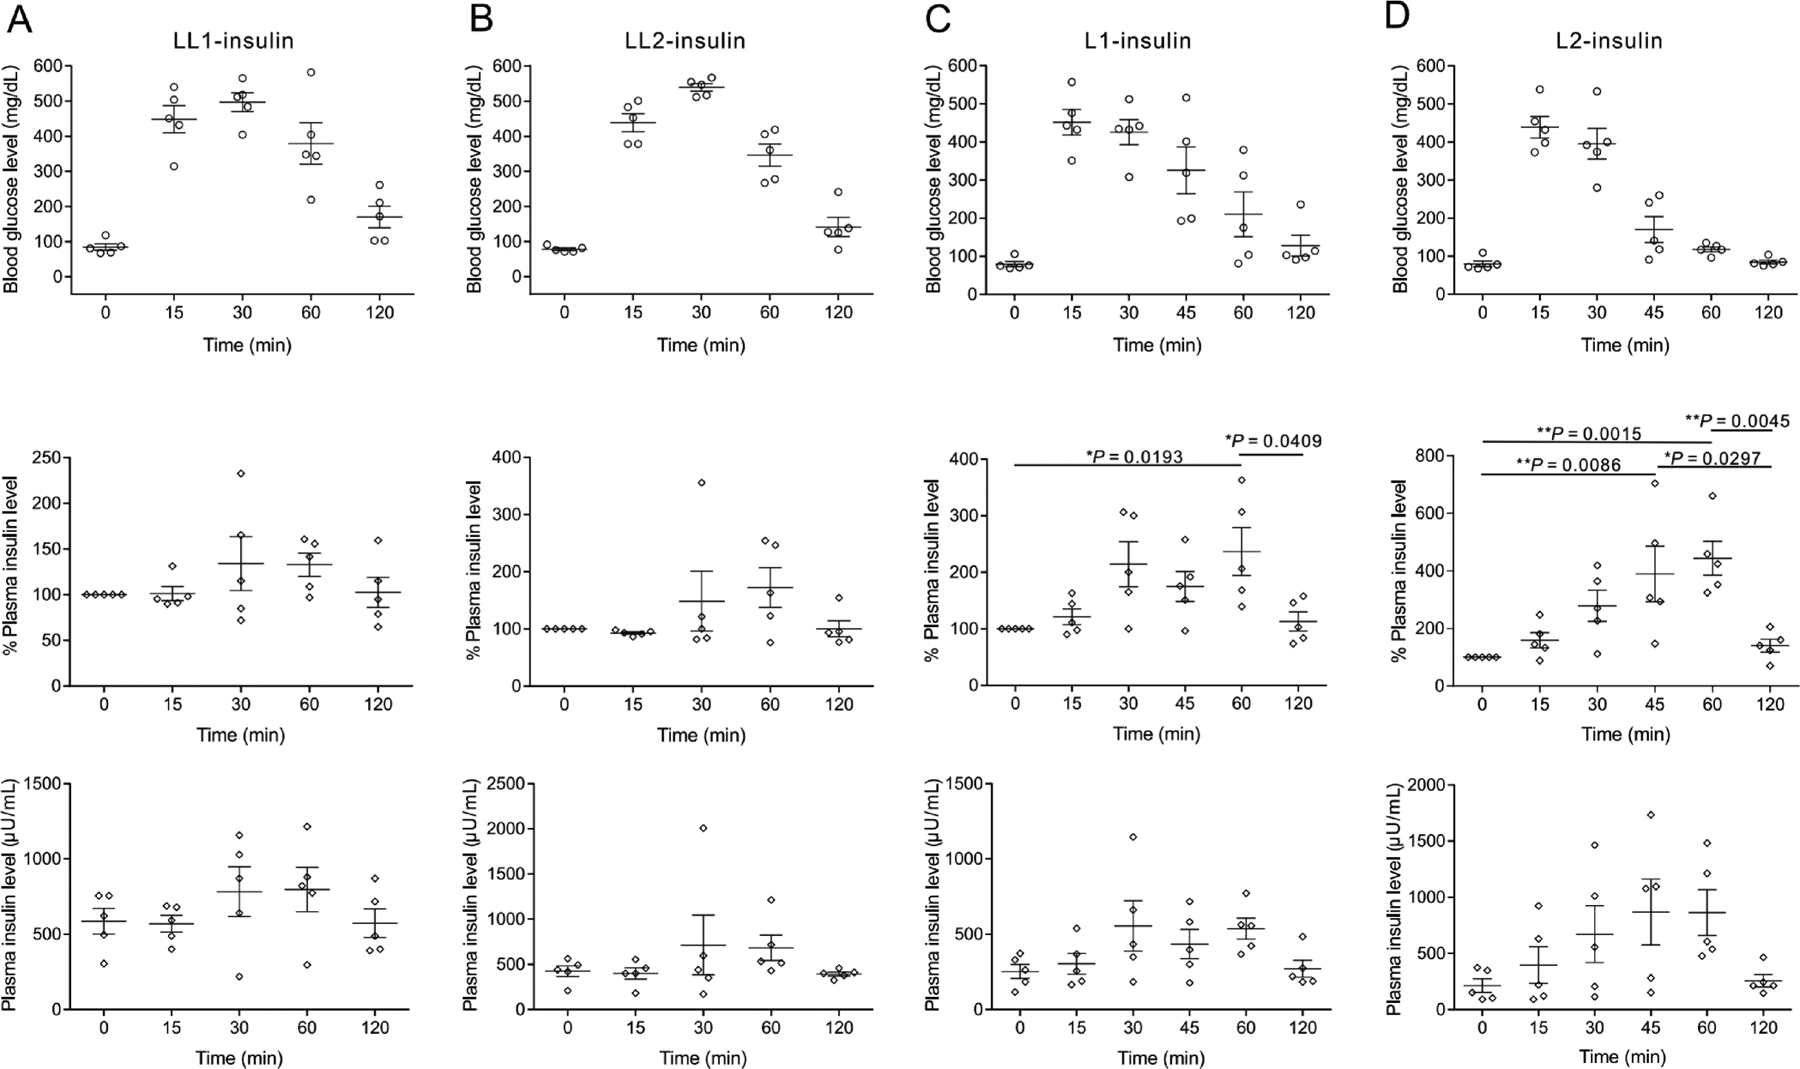
Plasma insulin level change associated with intraperitoneal glucose tolerance test in diabetic mice. The diabetic mice were treated with LL1-insulin (A), LL2-insulin (B), L1-insulin (C), and L2-insulin (D), respectively. The insulin-equivalent dose was set to 1.5 mg/kg. The glucose (3 g/kg) was given at 8 h post-treatment with complexes. The plasma insulin level of each mouse just before treatment was set as 100%. The 0 min time point was set at the time of glucose injection. Data are mean ± SEM (n = 5). One-way ANOVA with Tukey post-hoc tests were used to carry out multiple comparisons. *P < 0.05; **P < 0.01.