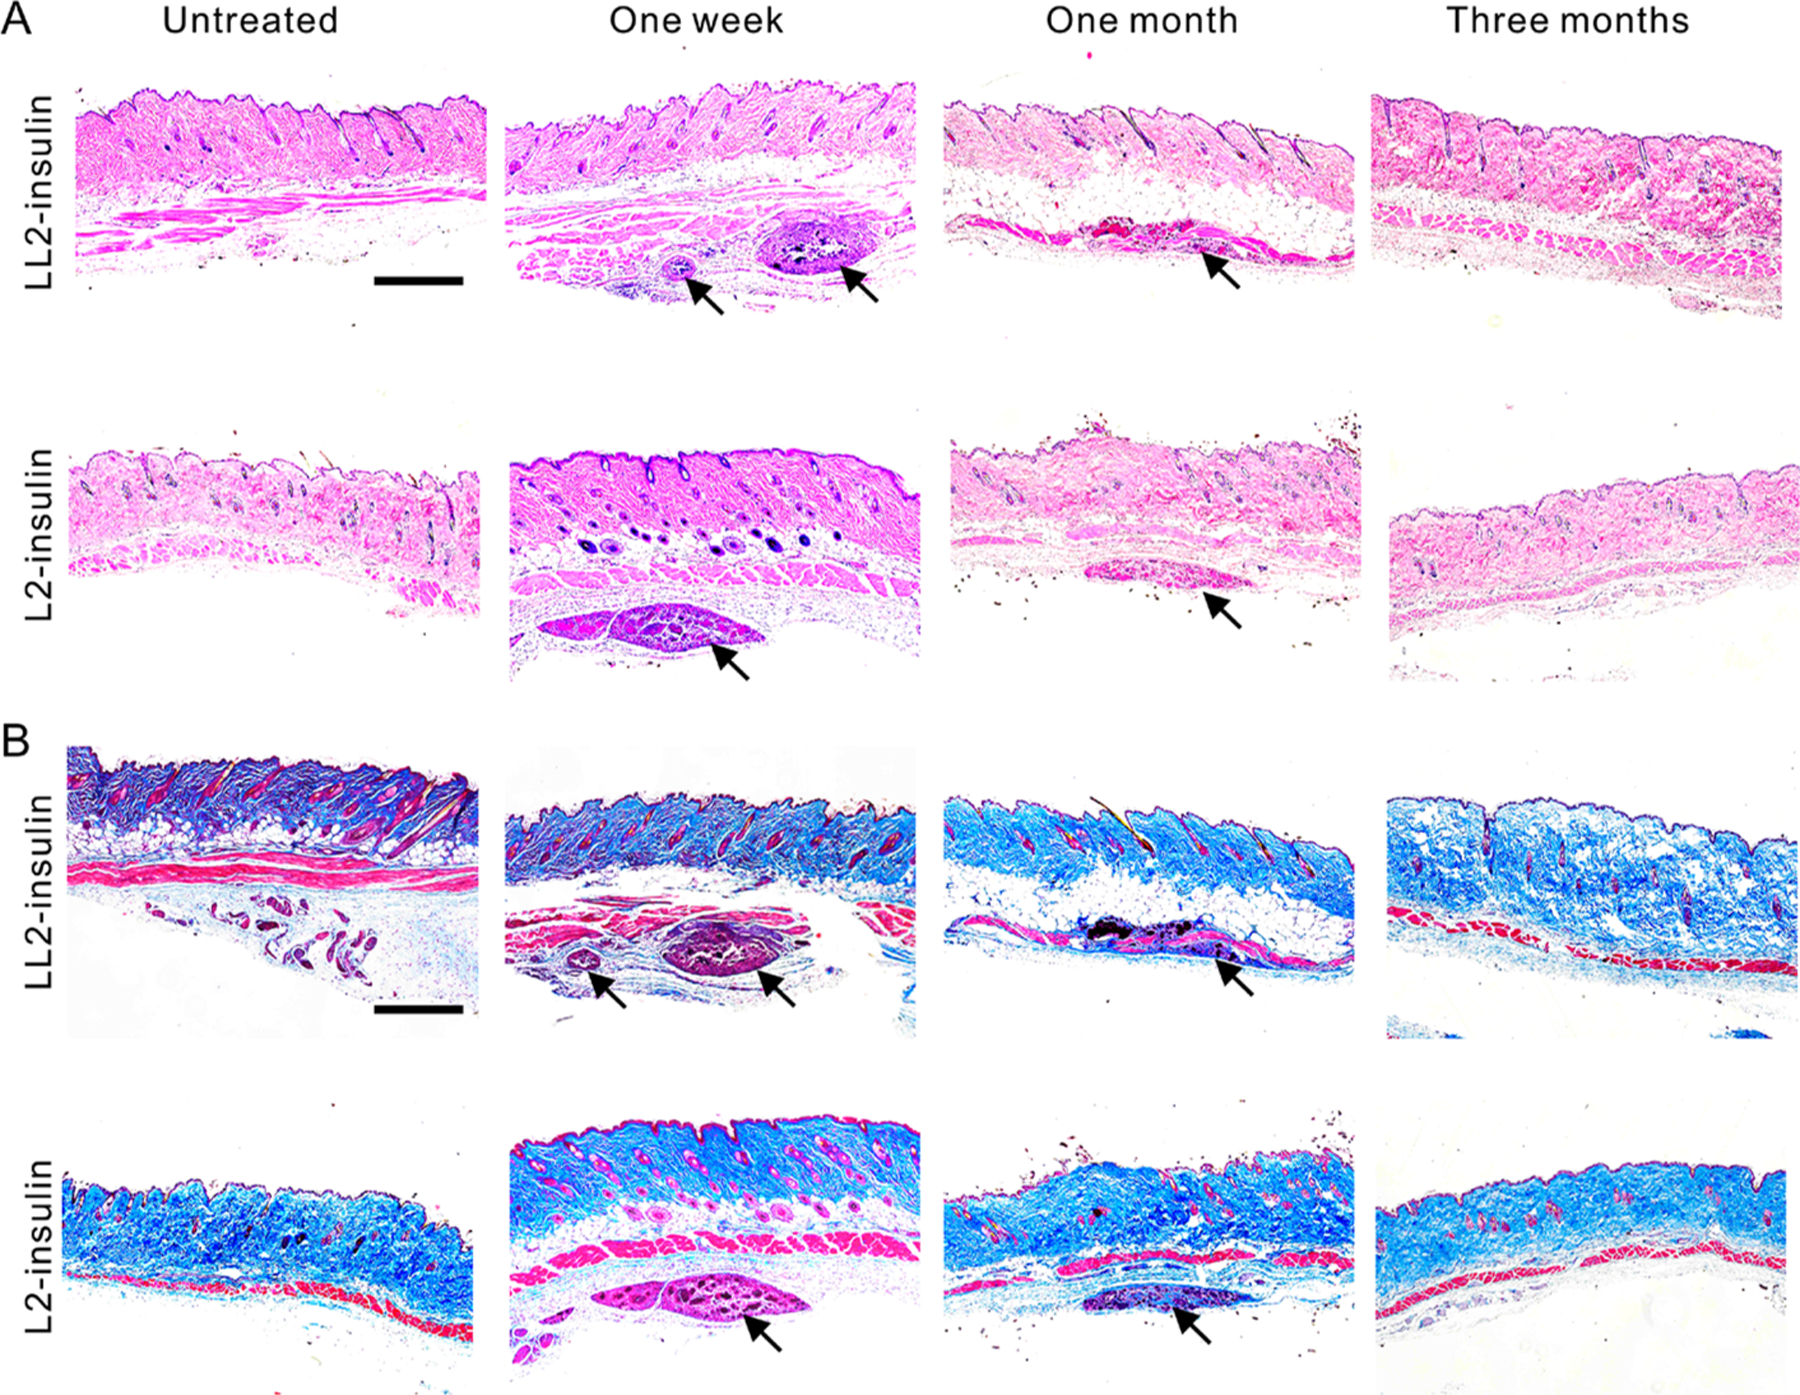
Figure 5.

Representative images of H&E or Masson’s trichrome staining sections. Diabetic mice were injected with various complexes and the skins at the treatment sites were obtained between time intervals. H&E staining (A) and Masson’s trichrome staining (B) were performed. The images were taken on a microscope (Nikon, Ti–U). The skins without treatment were used as control samples. Black arrows indicate the injected complexes. Scale bars, 250 μm.
