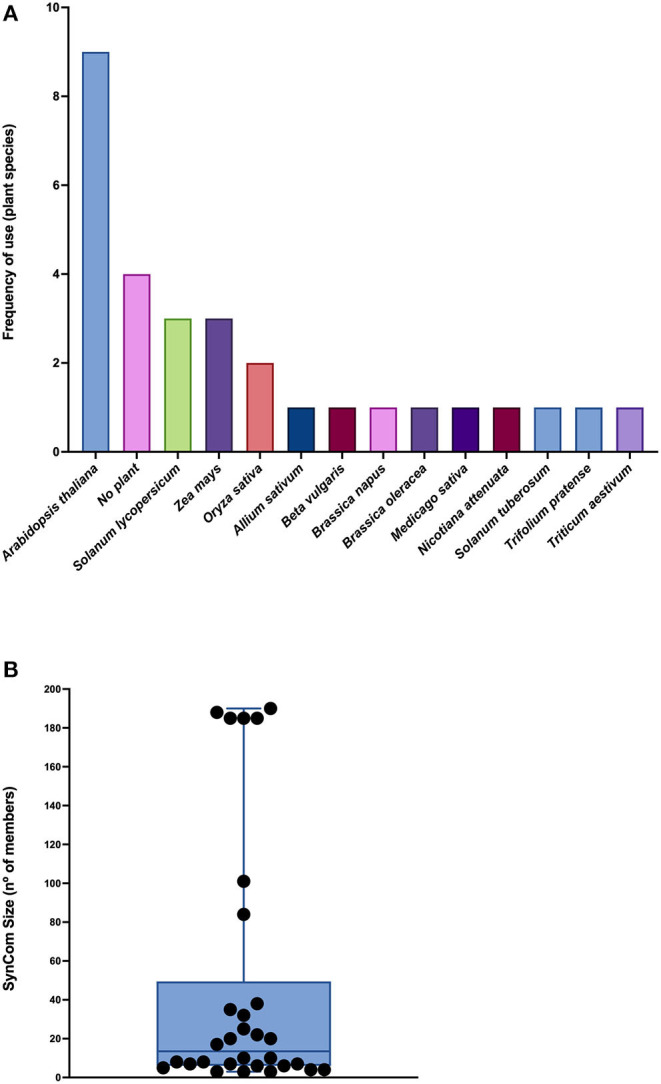
Figure 1.

Plant models and SynCom sizes reported in the literature. (A) Frequency of use of plant species in the selected articles. (B) Box plot showing the number of members used in SynComs. Each dot represents an article. The horizontal line corresponds to the median.
