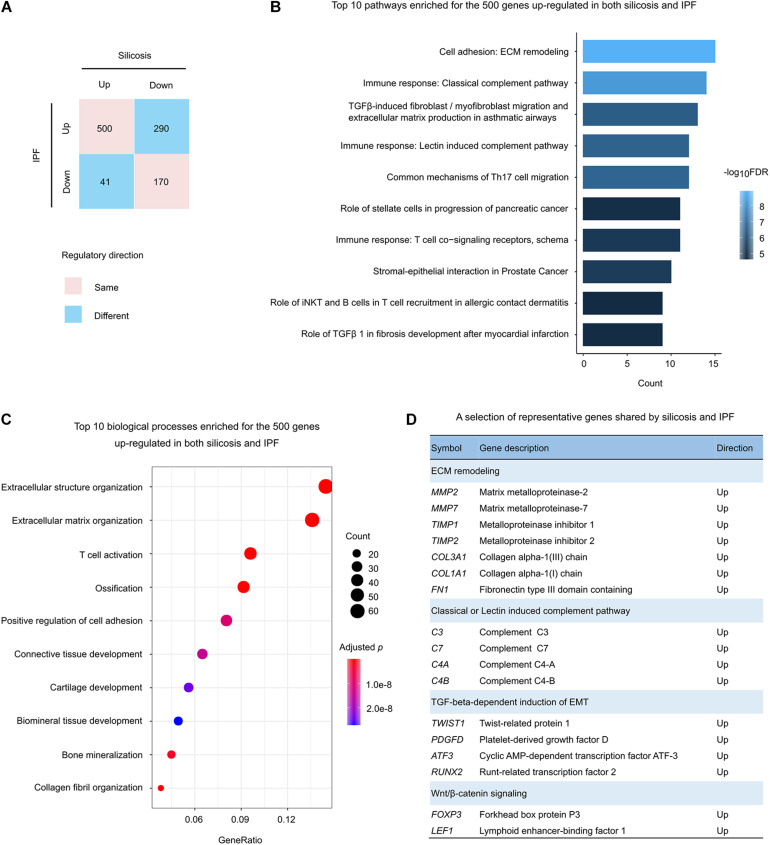
FIGURE 4.
Functional analysis of the genes regulated in both silicosis and IPF. (A) Statistics of the gene counts regulated in both silicosis and IPF. Pink squares indicate genes regulated in the same direction (up or down) in both diseases; blue squares indicate genes regulated in different directions in the two diseases. (B) The top 10 pathways significantly enriched for the 500 genes up-regulated in both silicosis and IPF. (C) The top 10 significant biological processes enriched for the 500 genes up-regulated in both silicosis and IPF. The size of dots reflects the gene counts for each process. Dot color reflects adjusted p-values, where the most significant result is red. (D) Representative genes selected from significant pathways shared by silicosis and IPF.

