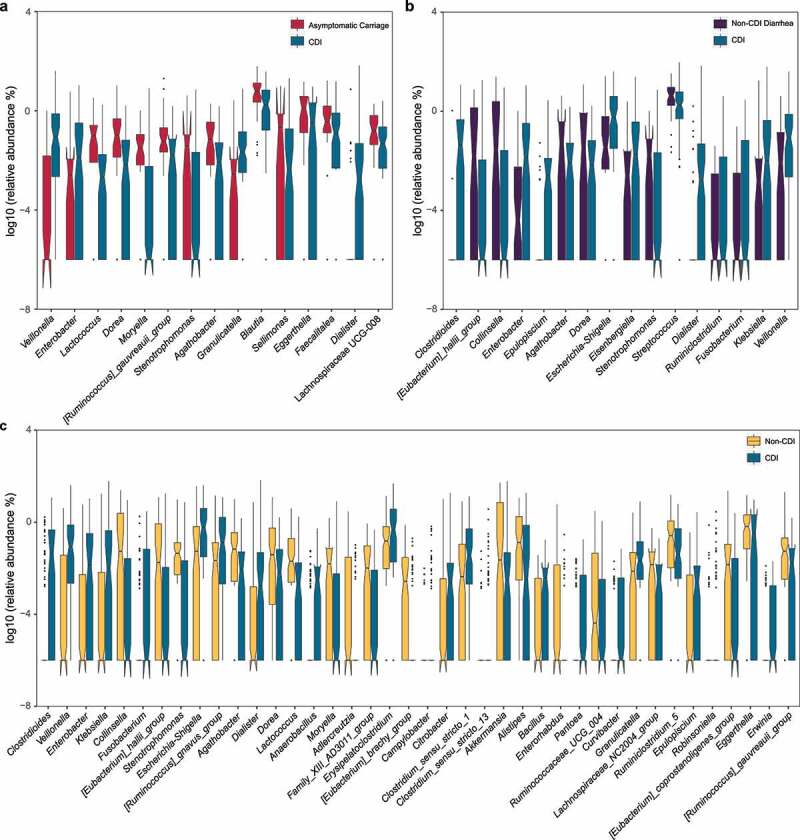
Figure 2.

Relative abundances of differentially abundant genera identified by ANCOM in comparing different groups. (a) CDI vs. Asymptomatic Carriage. (b) CDI vs. Non-CDI Diarrhea. (c) CDI vs. Non-CDI. The top differentially abundant taxa were ranked based on their W statistics (a high “w score” generated by this test indicates the greater likelihood that the null hypothesis can be rejected, indicating the number of times a parameter is significantly different between groups) (from left to right). The relative abundance (%) are plotted on log10 scale. The notches in the boxplots show the 95% confidence interval around the median
