
Figure 3.
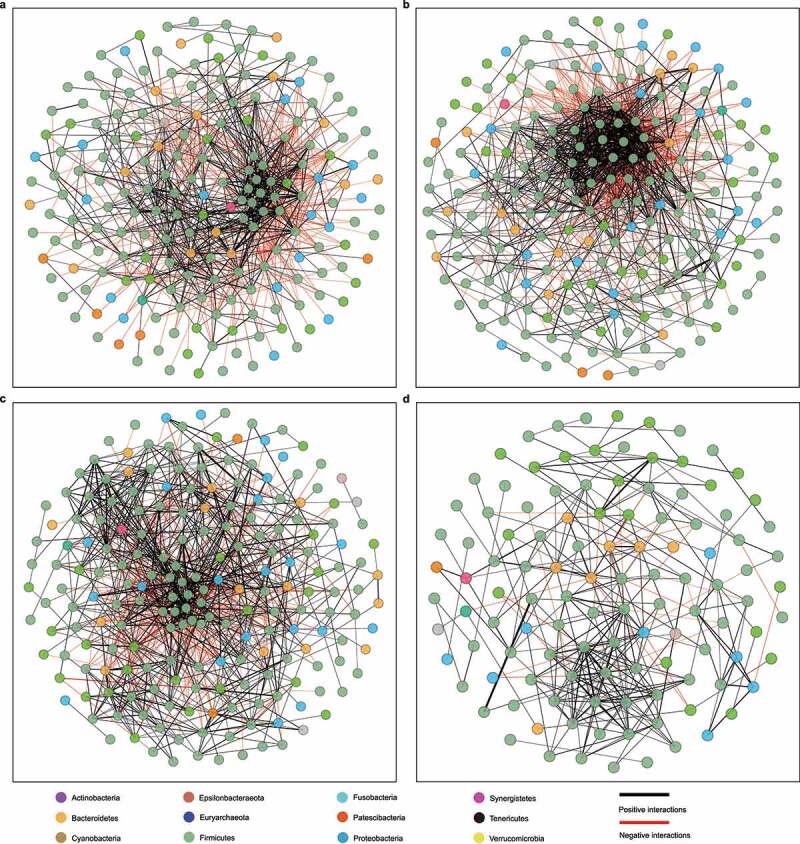
Microbial correlation networks of different groups. (a) Control. (b) Non-CDI Diarrhea. (c) Asymptomatic Carriage. (d) CDI. Nodes represent genera and are colored based on their phylum. Edges represent microbial correlations: green/red means positive/negative correlations, respectively. Edge thickness indicates correlation strength, and only the high-confidence interactions (p-value < 0.05) with high absolute correlation coefficients (> 0.3) were presented. For each group, we further identified the top-three most connected genera/nodes. They are Ruminococcus_1, Roseburia and Lachnospiraceae_UCG_008 for the Control group, [Ruminococcus]_torques_group, [Eubacterium]_hallii_group and Blautia for the Non-CDI Diarrhea group, Ruminiclostridium_5, Enterococcus and Lachnospiraceae_UCG_008 for the Asymptomatic Carriage group, and Alistipes, Ruminiclostridium_5 and Lachnoclostridium for the CDI group