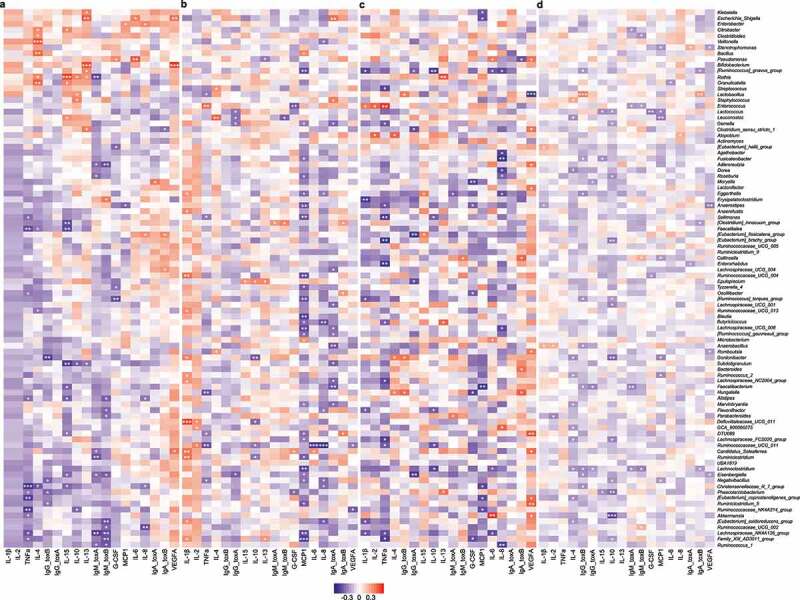
Figure 4.

Correlations between gut microbial abundances and host immune markers in different groups, quantified by Spearman correlation with Benjamini-Hochberg correction. (a) Control. (b) Non-CDI Diarrhea. (c) Asymptomatic Carriage. (d) CDI. Rows represent genera; columns represent immune markers. The layout of the heatmap is followed the hierarchical clustering results of Control cohort (see Supplementary Figure 4). Red/blue represents positive/negative correlation, respectively. The intensity of the colors denotes the strength of the correlation. *α < 0.05, **α < 0.01, ***α < 0.001
