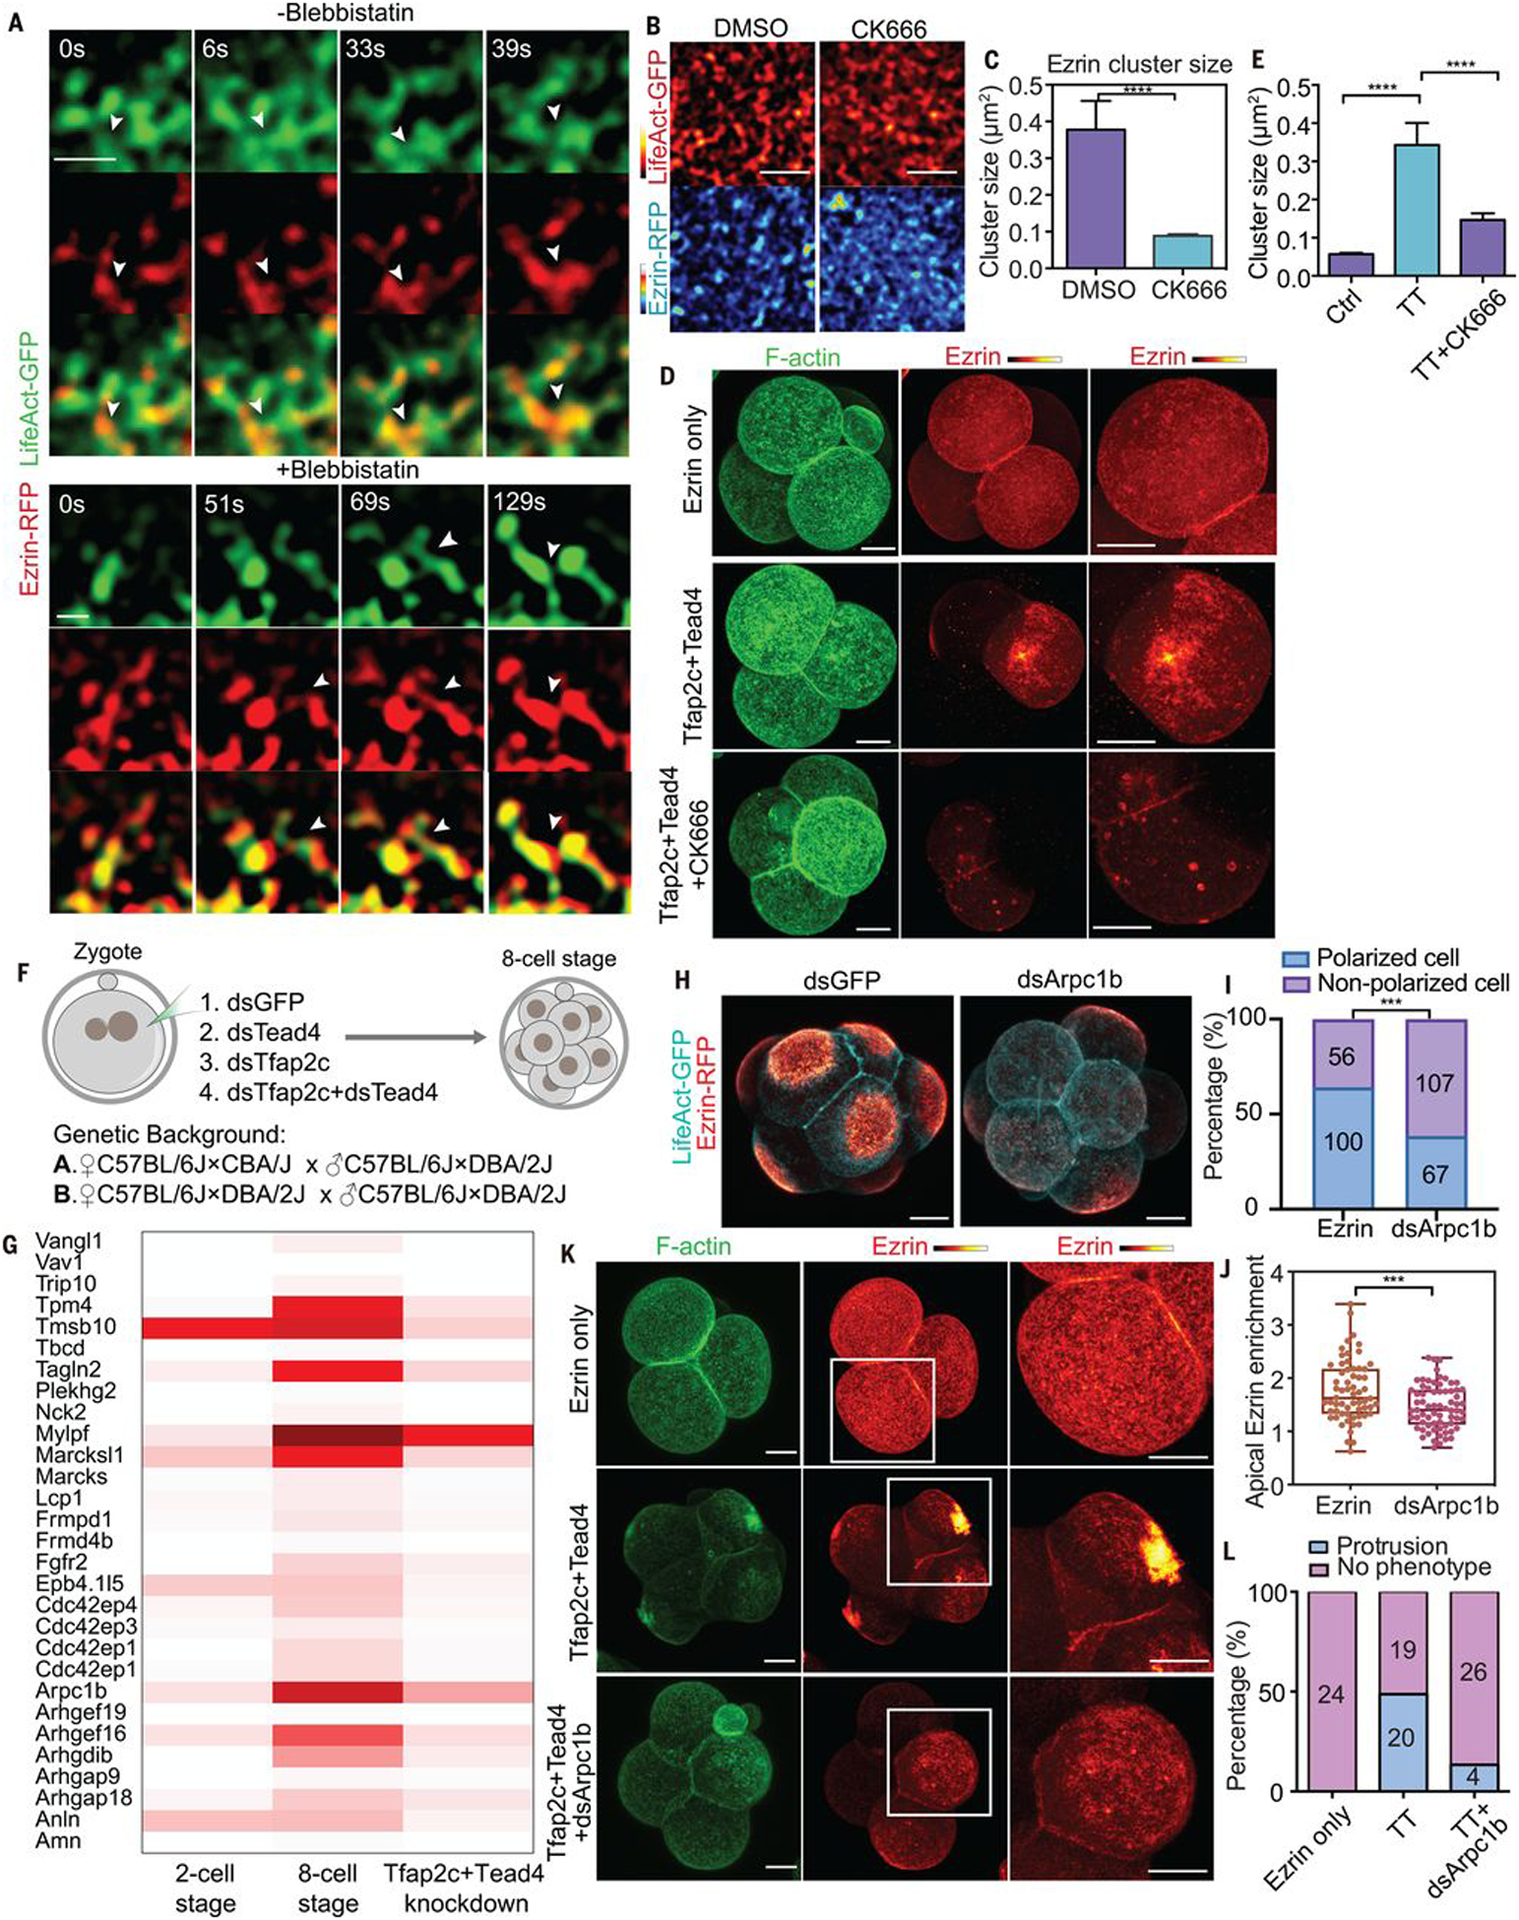
Fig. 5. Clustering of apical proteins is regulated by local actin dynamics.

(A) LifeAct-GFP and ezrin-RFP dynamics with or without blebbistatin treatment during polarization. Arrowheads indicate the merging of ezrin clusters during actin polymerization. Scale bar, 1 μm. N = 5 cells for each condition. N = 3 experiments. Blebbistatin treatment did not prevent the clustering of actin or ezrin proteins. (B) LifeAct-GFP and ezrin-RFP localization in mid eight-cell stage embryos treated with DMSO (control) and CK666. Scale bars, 5 μm. (C) Ezrin cluster size in cells treated with DMSO or CK666 in (B). ****P < 0.0001, Mann-Whitney U test. More than 1500 clusters were measured in each condition, N = 2 experiments. (D) F-actin and ezrin-RFP localization in late four-cell-stage embryos expressing ezrin-RFP only, or with Tfap2c+Tead4 treated with or without CK666. (E) Ezrin cluster size in (D). ****P < 0.0001, Kruskal-Wallis test. More than 1100 clusters were calculated in each condition, N = 2 experiments. (F) Experimental strategy for RNA-seq. (G) Heatmap showing the expression of selective cytoskeleton regulators downstream of Tfap2c and Tead4. (H) LifeAct-GFP and ezrin-RFP localization in dsGFP or dsArpc1b injected embryos. (I) Polarized cell numbers in dsGFP and dsArpc1b groups. Numbers within bars represent cell number. ***P < 0.001, Fisher’s exact test. (J) Ezrin-RFP apical enrichment in dsGFP or dsArpc1b cells. Each dot represents a cell. ***P < 0.001, Student’s t test. (K) LifeAct-GFP and ezrin-RFP localization in different conditions. Squares indicate magnified regions (right). (L) Number of cells showing apical protrusions in (K). Scale bars, 15 μm.
