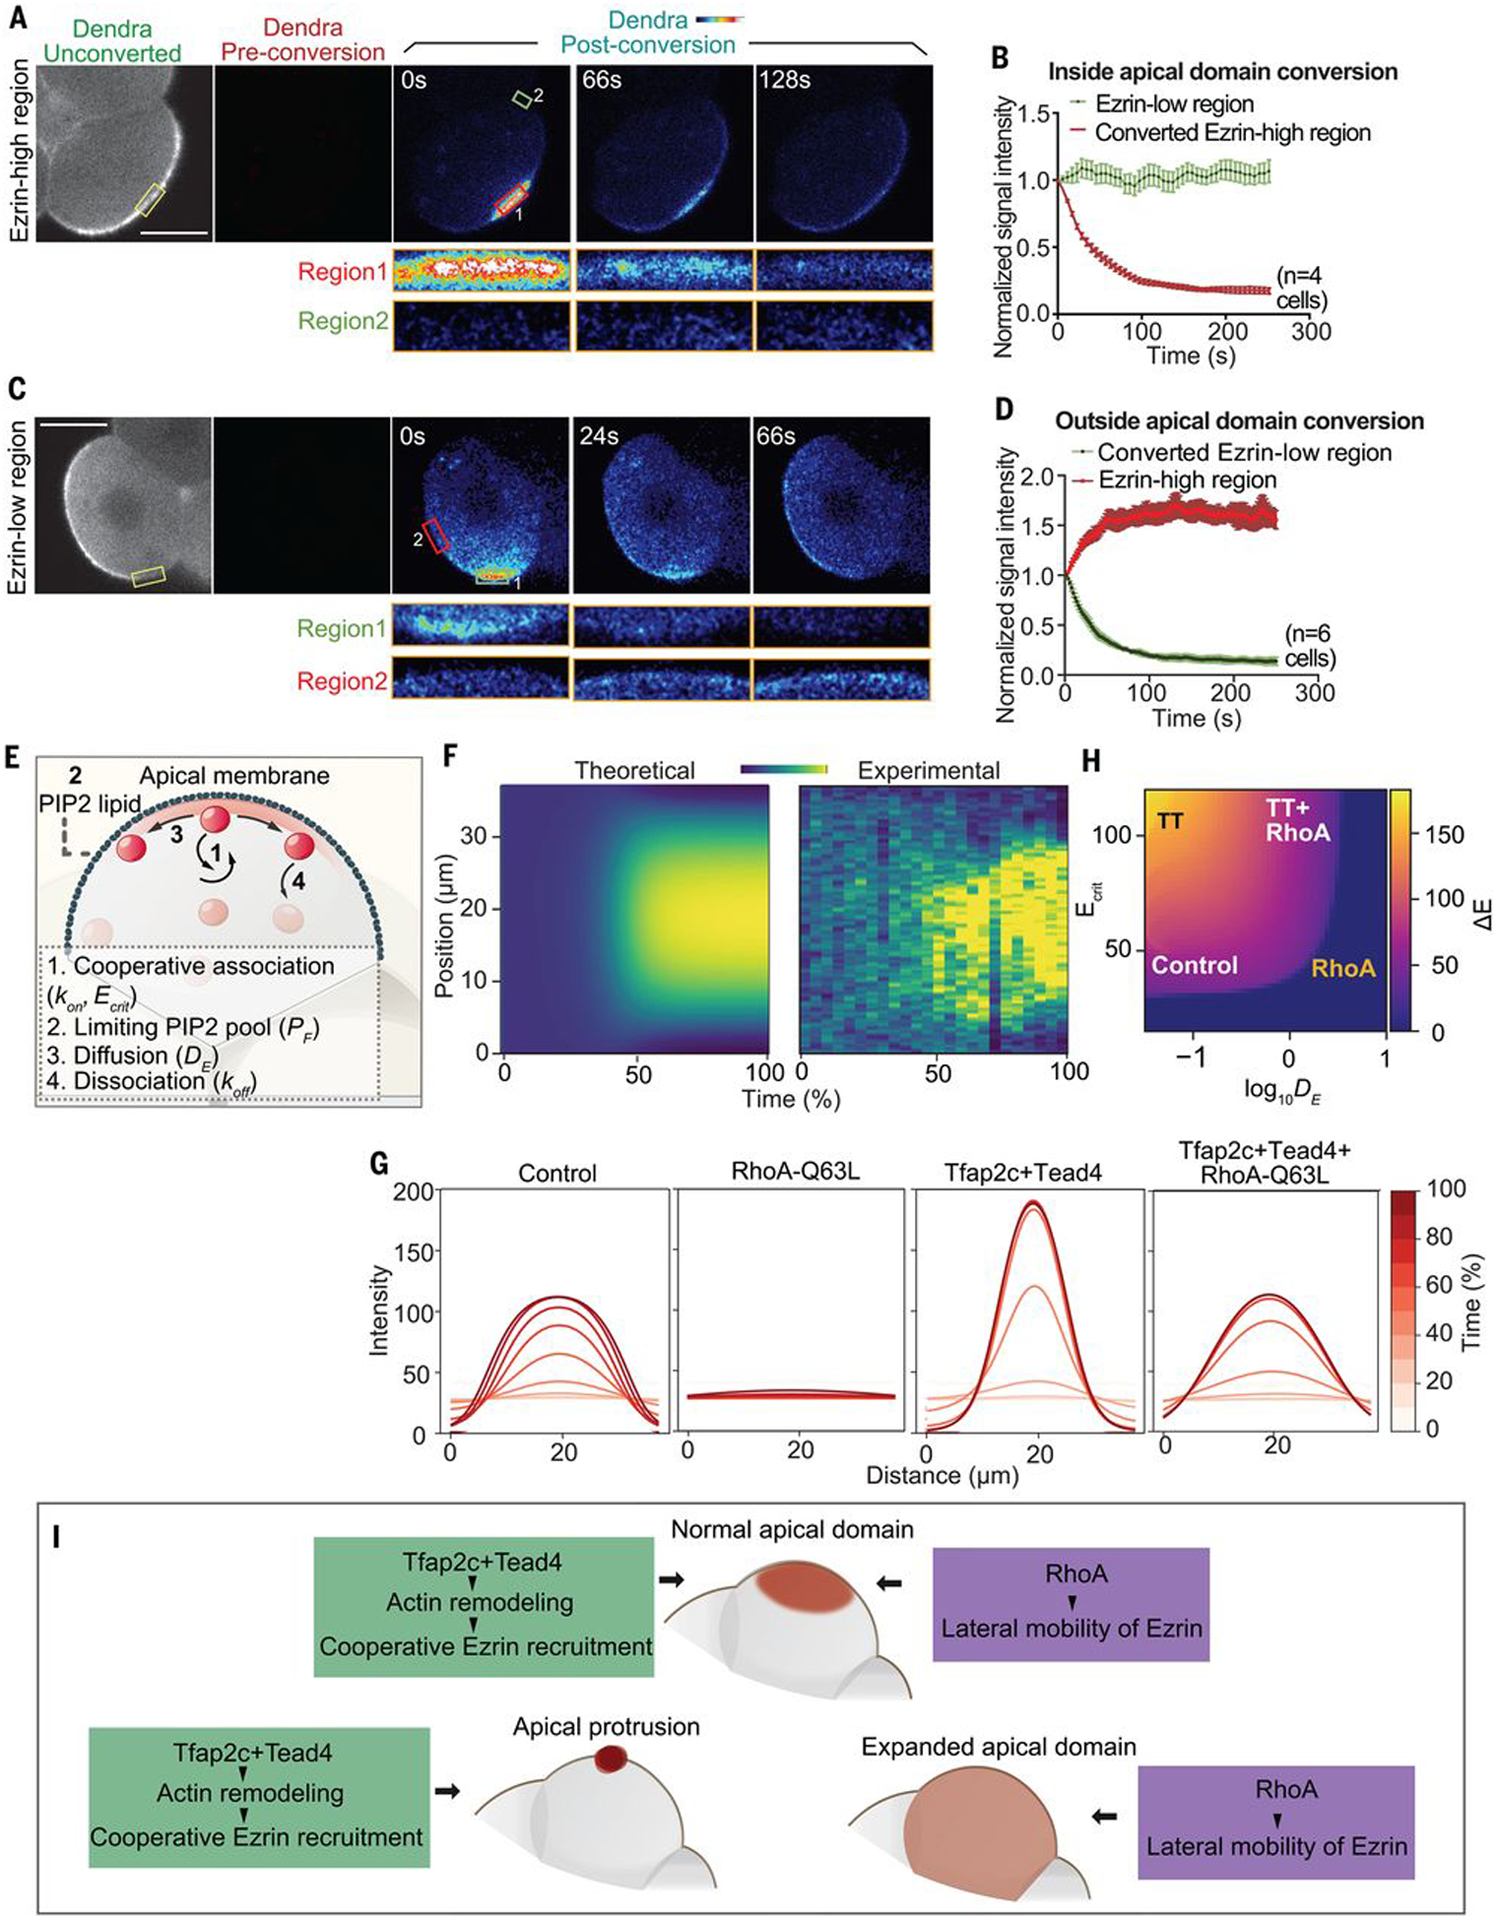
Fig. 6. Tfap2c, Tead4, and RhoA regulate apical domain formation through a positive feedback and mobility system.

(A and C) Ezrin-Dendra2 localization during and after photoconversion. Yellow squares indicate converted region, red and green squares indicate ezrin-high or ezrin-low regions, respectively, measured in (B) and (D). (B and D) Signal intensity of converted ezrin-Dendra2 [experimental setting shown in (A) and (C)] in ezrin-low and ezrin-high regions within 6 min after conversion. Scale bars, 15 μm. (E) Structure of the biophysical model. (F) Kymographs comparing in silico and in vivo polarization dynamics. Same color corresponds to the same ezrin intensity. (G) Time courses of simulated ezrin apical distribution at different regions of parameter space. Colors corresponding to the elapsed simulation time. (H) Phase space of polarization shape within the monopolar regime. (I) Summary of the results.
