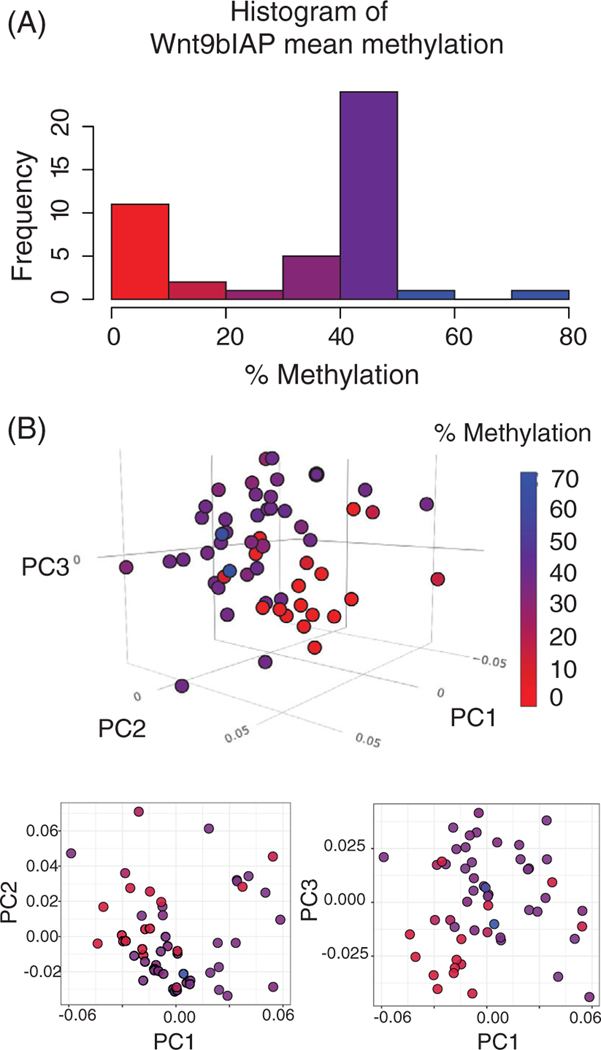
FIGURE 3.
(A) Mean Wnt9bIAP methylation levels. (B) Principal component analysis of shape data colored by the methylation level for each embryo. PC1 represents 15% of the total shape variation, PC2—14%, PC3—10%. 3D manipulatable figure can be found at http://rpubs.com/rgree/518509

