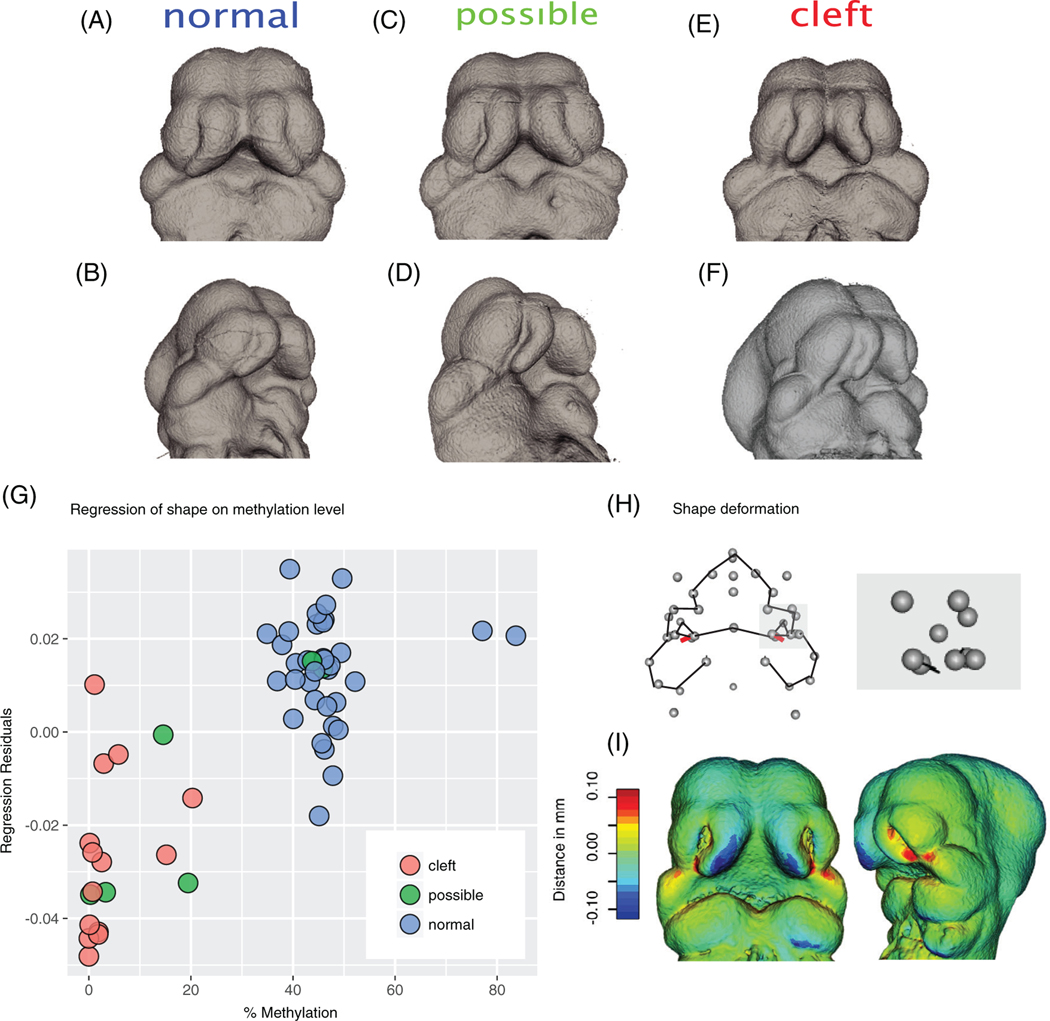
FIGURE 4.
(A-F) Raw microCT scans of E11.5 heads separated into different cleft categories. Note changes in the shape of the nasal process relative to the base of the face. (G, H) Regression of methylation level on shape. (G) Dots colored by cleft category. (H, I) Changes observed by movement along the axis defined by the regression from 0 to 100. Note that there are changes in three landmarks on each side which represent size/shape changes in this region

