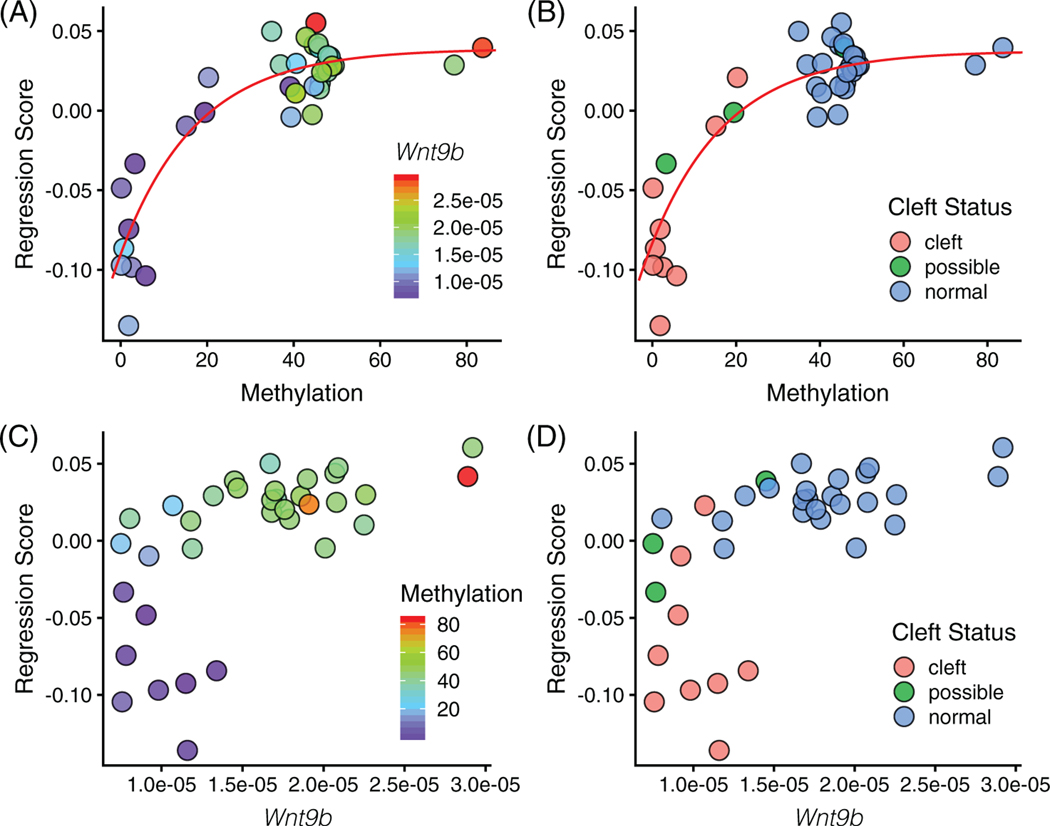
FIGURE 6.
Multivariate regression of shape on (A, B) Wnt9bIAP methylation and (C) Wnt9b. In (A), increasing methylation relates to increasing Wnt9b level. In (B), increasing Wnt9b relates to increasing methylation level. In (B, D), decreasing methylation or Wnt9b increases likelihood of cleft. Red lines correspond to von Bertalanffy growth equations fit using least squares regression, methylation: shape = 0.0369 − (0.0369 − 0.0965) e−0.0605 * methylation

