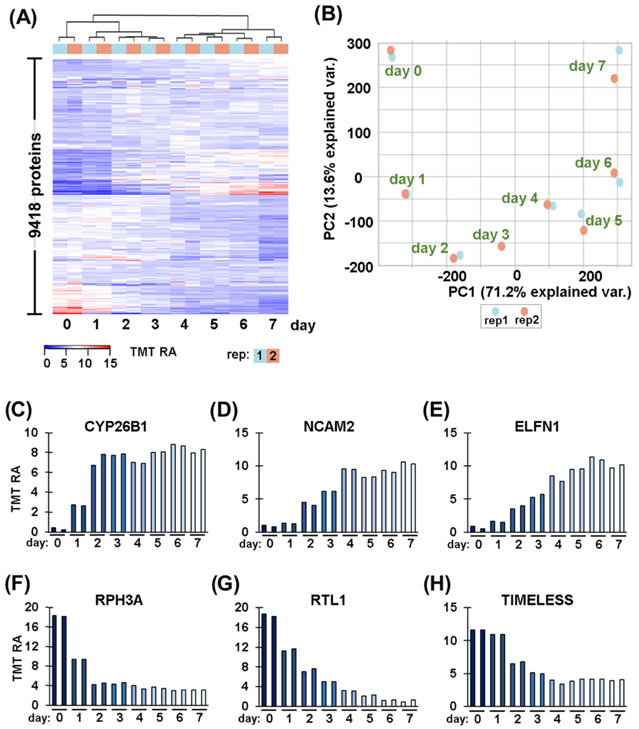
Figure 3.
Temporal differences in protein expression. (A) Heat map illustrates the relative abundance of the 9418 proteins quantified in this time-course experiment. The abundance values for each protein sum to 100 across the 16 channels. (B) Principal components analysis (PCA) of the 16 samples depicts the variance explained by the first two principal components (PC). Temporal expression patterns of proteins highlighted in Figure 2: (C) CYP26B1, cytochrome P450 26B1; (D) NCAM2, neural cell adhesion molecule 2; (E) ELFN1, extracellular leucine-rich repeat and fibronectin type III, (F) RPH3A, rabphilin-3A; (G) RTL1, retrotransposon-like protein 1; and (H) TIMELESS.

