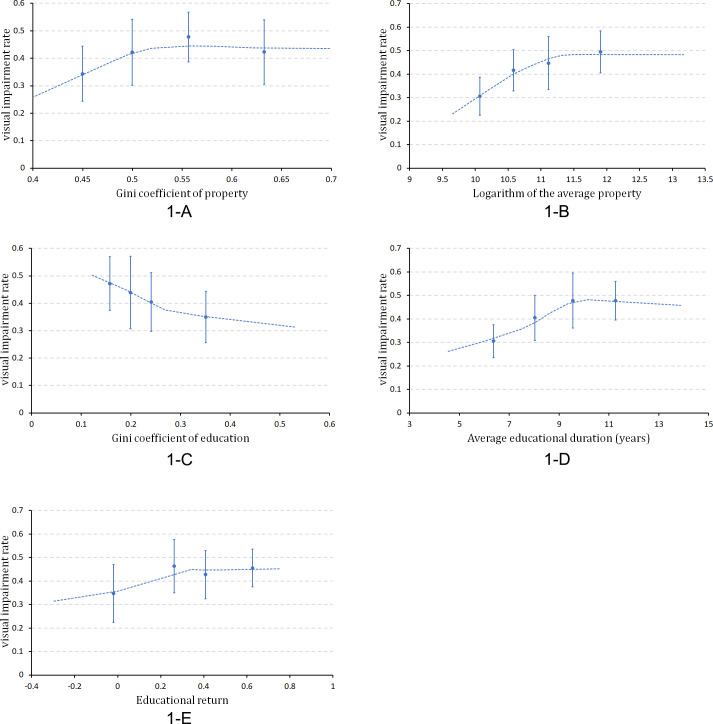
Figure 1.
The relationship between the visual impairment rate and socioeconomic indicators. We equally divided the records into four subgroups, respectively, in each panel, according to the value of the corresponding socioeconomic indicator from the minimum to the maximum. The blue dot represented the means of the corresponding socioeconomic indicator and the visual impairment rate of each subgroup, and the solid blue line represented the SD of the visual impairment rate. The blue dotted line was the fitting result of the LOESS regression. (A) It could be found that before the sharp peak of the Gini coefficient of property, the visual impairment rate continued to rise; however, after the peaks, the rate was essentially stable. (B) It could be found that before the sharp peak of the logarithm of the average property, the visual impairment rate continued to rise; however, after the peaks, the rate was essentially stable. (C) It could be found that before the sharp peak of the Gini coefficient of education, the visual impairment rate continued to decrease; however, after the peaks, the rate was gradually becoming stable. (D) It could be found that before the sharp peak of the average educational duration, the visual impairment rate continued to rise; however, after the peaks, the rate was essentially stable. (E) It could be found that before the sharp peak of the educational return, the visual impairment rate continued to rise; however, after the peaks, the rate was essentially stable. LOESS, locally weighted scatterplot smoothing.

