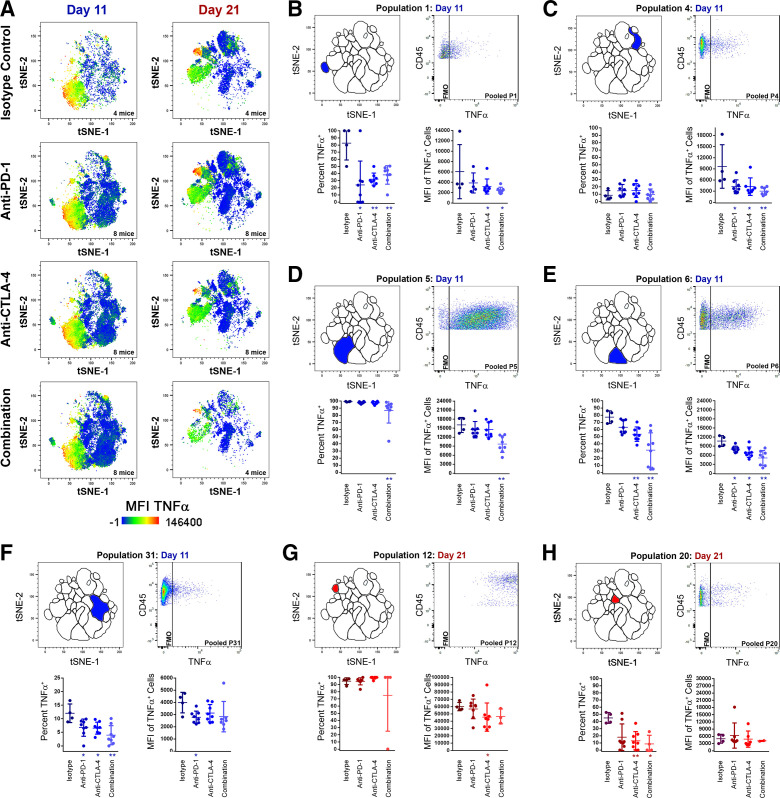
Figure 3.
Changes in TNFα production among TIL populations following treatment with checkpoint inhibitors at early (day 11) and late (day 21) time points. (A) t-SNE plots with TNFα heat map overlays of combined TIL samples from control (isotype treated) mice, or mice receiving anti-PD-1, anti-CTLA-4, or combination treatment (anti-PD-1 and anti-CTLA-4) at day 11 and day 21 of subcutaneous MC38 tumor growth, with warm colors (red) representing higher staining levels and cool colors (blue) representing lower staining levels. A TNFα MFI scale is noted below. (B–H) Analyses of TNFα expression for P1 day 11 (B), P4 day 11 (C), P5 day 11 (D), P6 day 11 (E), P31 day 11 (F), P12 day 21 (G), and P20 day 21 (H). For each, the location of the population within the t-SNE analysis is depicted in the top left, a pooled TNFα dot plot versus CD45.2 expression in the top right, percentage of cells expressing TNFα (bottom left), and TNFα MFI of TNFα+ cells (bottom right) are shown. Data in blue colors denote the day 11 time point, while data in red colors denote the day 21 time point (*p≤0.05 treatment vs isotype control; **p≤0.01 treatment vs isotype control). MFI, median fluorescent intensity; t-SNE, t-distributed stochastic neighbor embedding; TIL, tumor infiltrating lymphocyte.

