Figure 7.

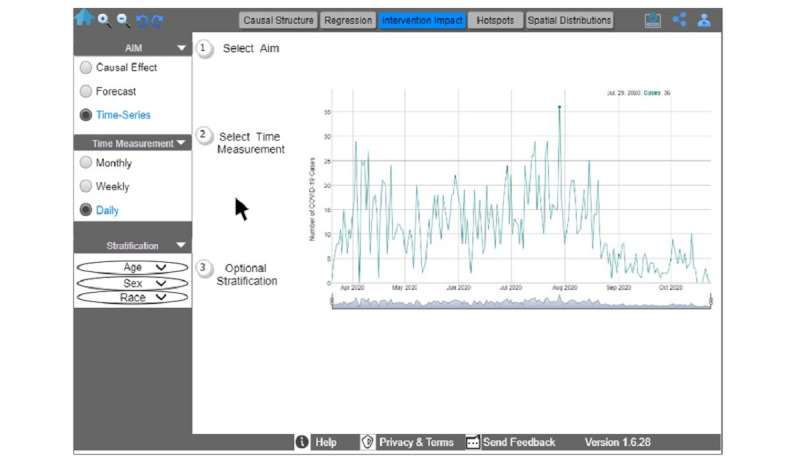
An interactive time-series graph that allows users to hover and explore COVID-19 cases, select the time measurement of interest, optionally stratify data on the basis of age, sex, or race, and expand or shrink the graph.

An interactive time-series graph that allows users to hover and explore COVID-19 cases, select the time measurement of interest, optionally stratify data on the basis of age, sex, or race, and expand or shrink the graph.