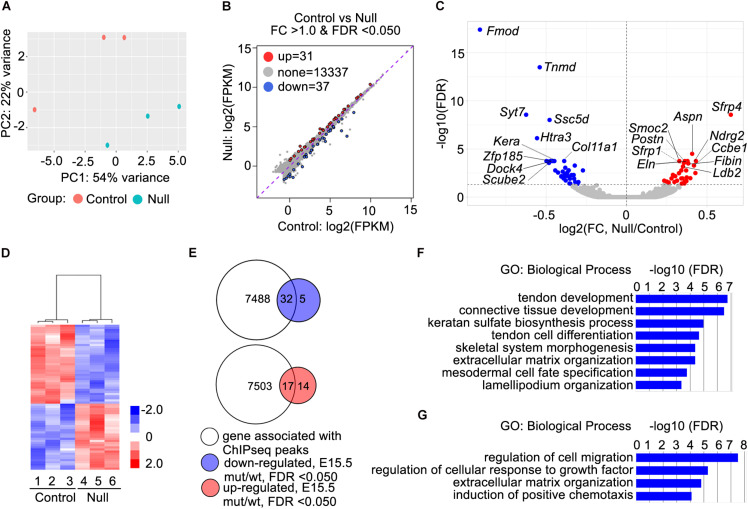
FIGURE 4.
RNA-seq data analysis and identification of candidate Scx direct target genes. (A) Principal component plot displaying the three Scx–/– and three control samples along PC1 and PC2, which account for 54 and 22%, respectively, of the variability within the RNA-seq dataset. (B) MA plot displaying differential expression profiles of the Scx–/– and control samples. Up-regulated genes are marked in red whereas down-regulated genes are marked in blue. (C) Volcano plot displaying the log2 fold change against the log10 value of the FDR adjusted P value. Up-regulated genes are shown in red while down-regulated genes shown in blue. Top 10 down-regulated and top 10 upregulated genes are marked by with symbol. (D) Heatmap showing hierarchical clustering on the 68 differentially expressed genes. The z-score scale bar represents relative expression+/- 2SD from the mean. (E) Comparisons of 7520 genes with associated Scx binding peaks with 37 down-regulated genes in Scx–/– samples at E15.5 and 31 up-regulated genes in Scx–/– samples at E15.5 (B). (F,G) Gene ontology analyses of 32 down-regulated genes associated with Scx-binding peaks and 17 up-regulated genes associated with Scx-binding peaks, respectively. Representative GO terms are listed in the order of their P values, with the most enriched GO term on top.

