Figure 3:

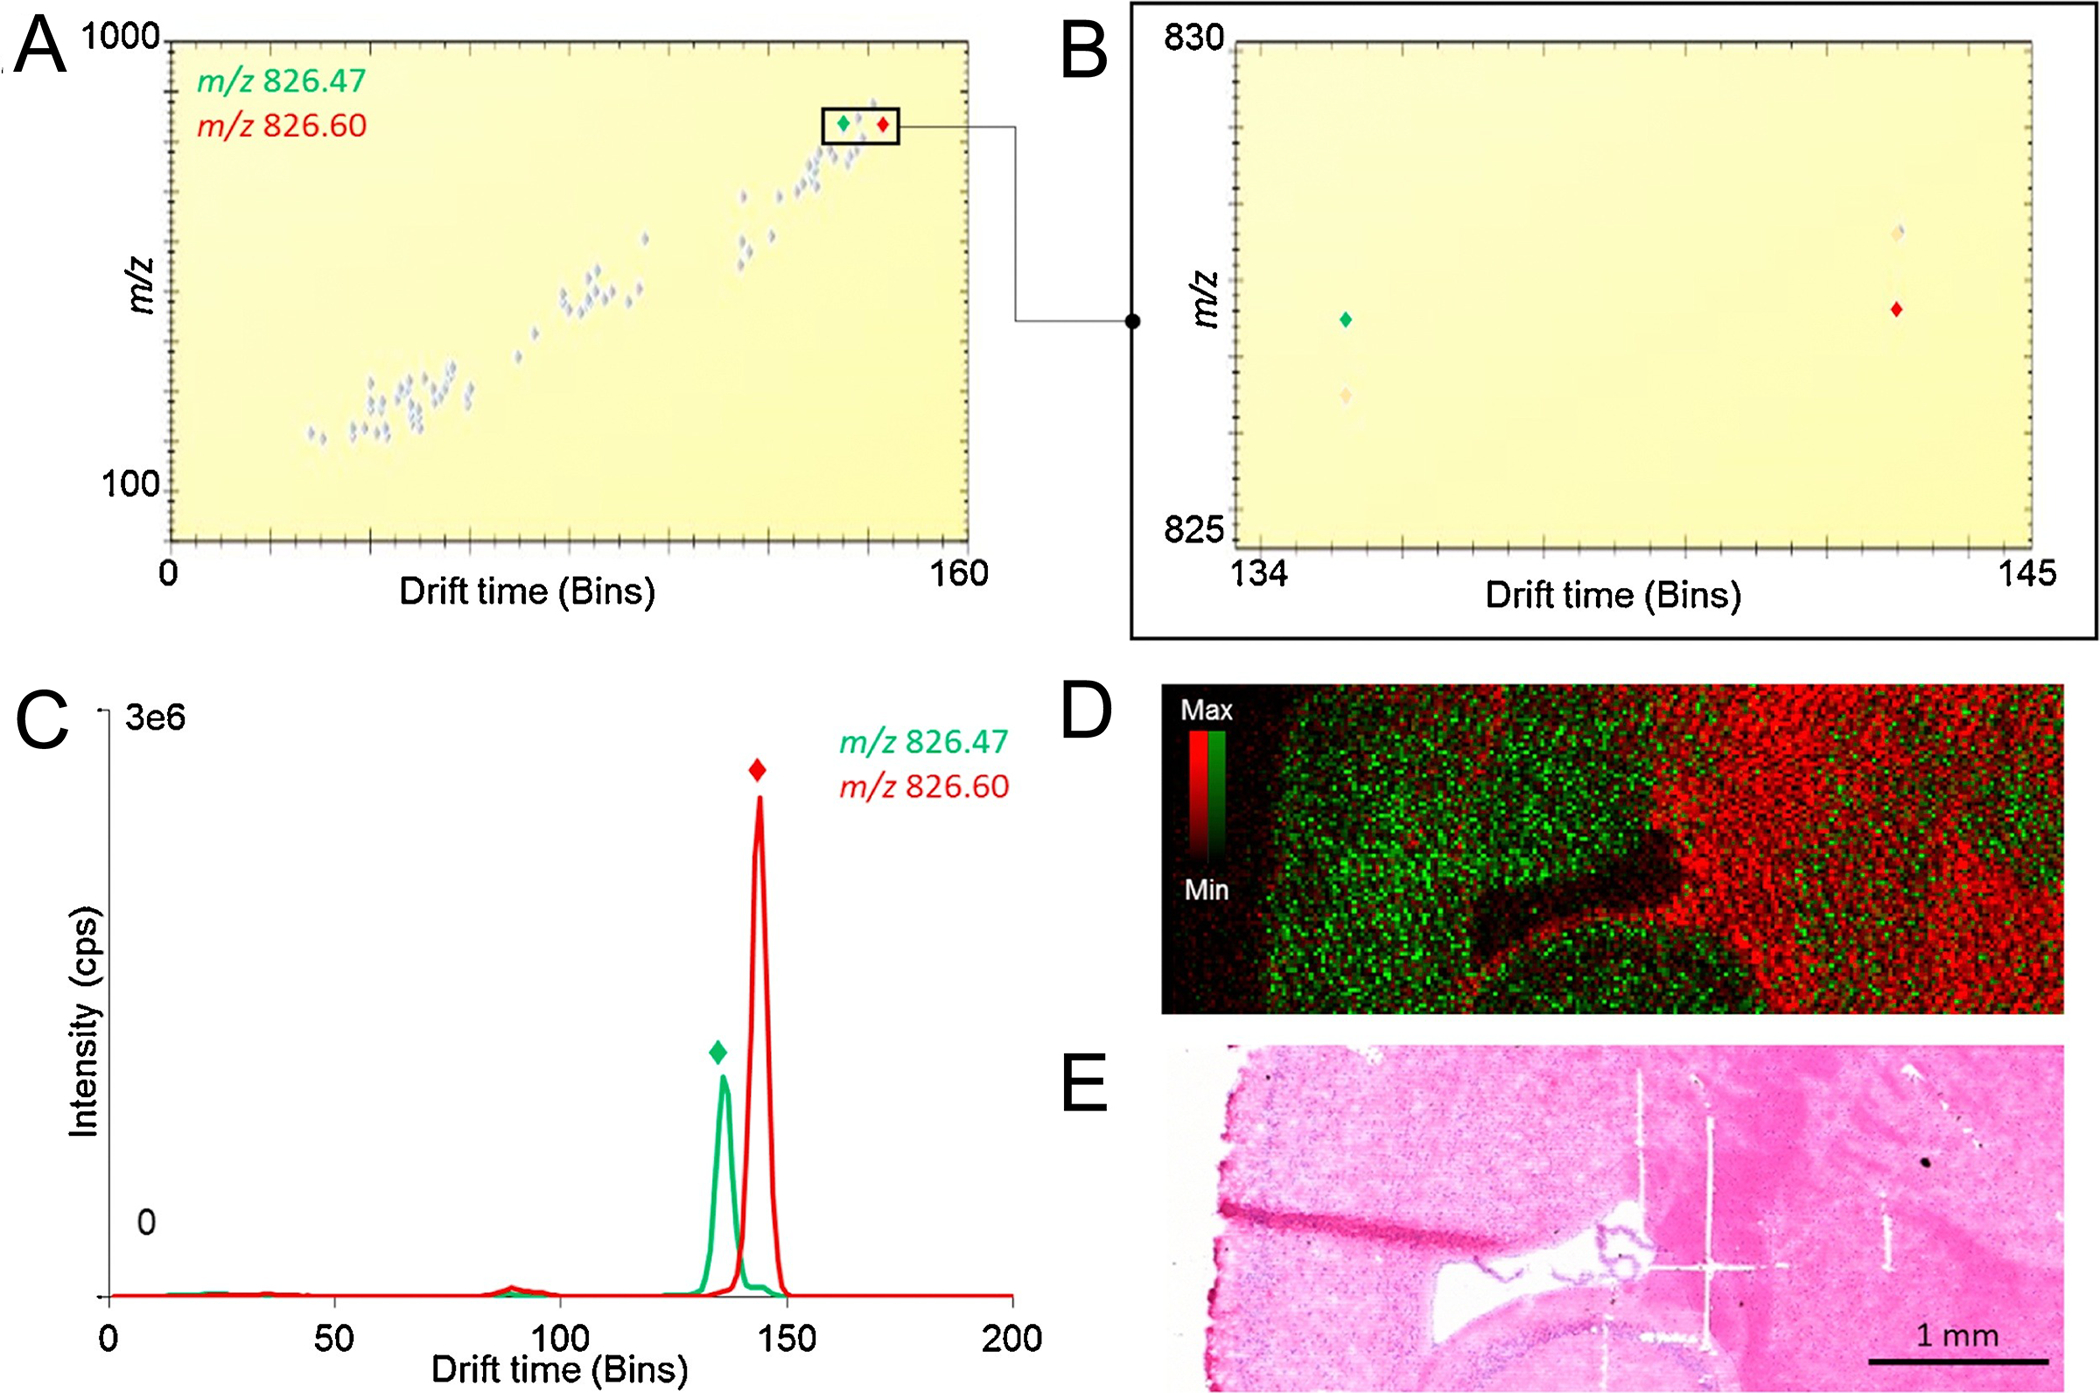
TWIMS provides an orthogonal level of separation for isobaric ions, aiding in the elucidation of distinct spatial distributions in murine brain tissue. Data was collected in continuous rastering mode at 20 μm spatial resolution on a Synapt G2-Si mass spectrometer equipped with a prototype “μMALDI” ion source. (A) Ion mobiligram averaged from the full m/z range acquired. (B) Enlargement of drift range 134–145 (bins) and m/z 825–830. (C) Extracted ion mobiligram for [PC(18:1_18:0)+K]+ (green) and unidentified m/z 826.60 (red). (D) Overlay image of both species demonstrating unique distributions. (E) H&E stained image of tissue post-IMS. This figure is adapted with permission from ref36, Barre, F. et al. International Journal of Mass Spectrometry (2020). Copyright 2019 Elsevier.
