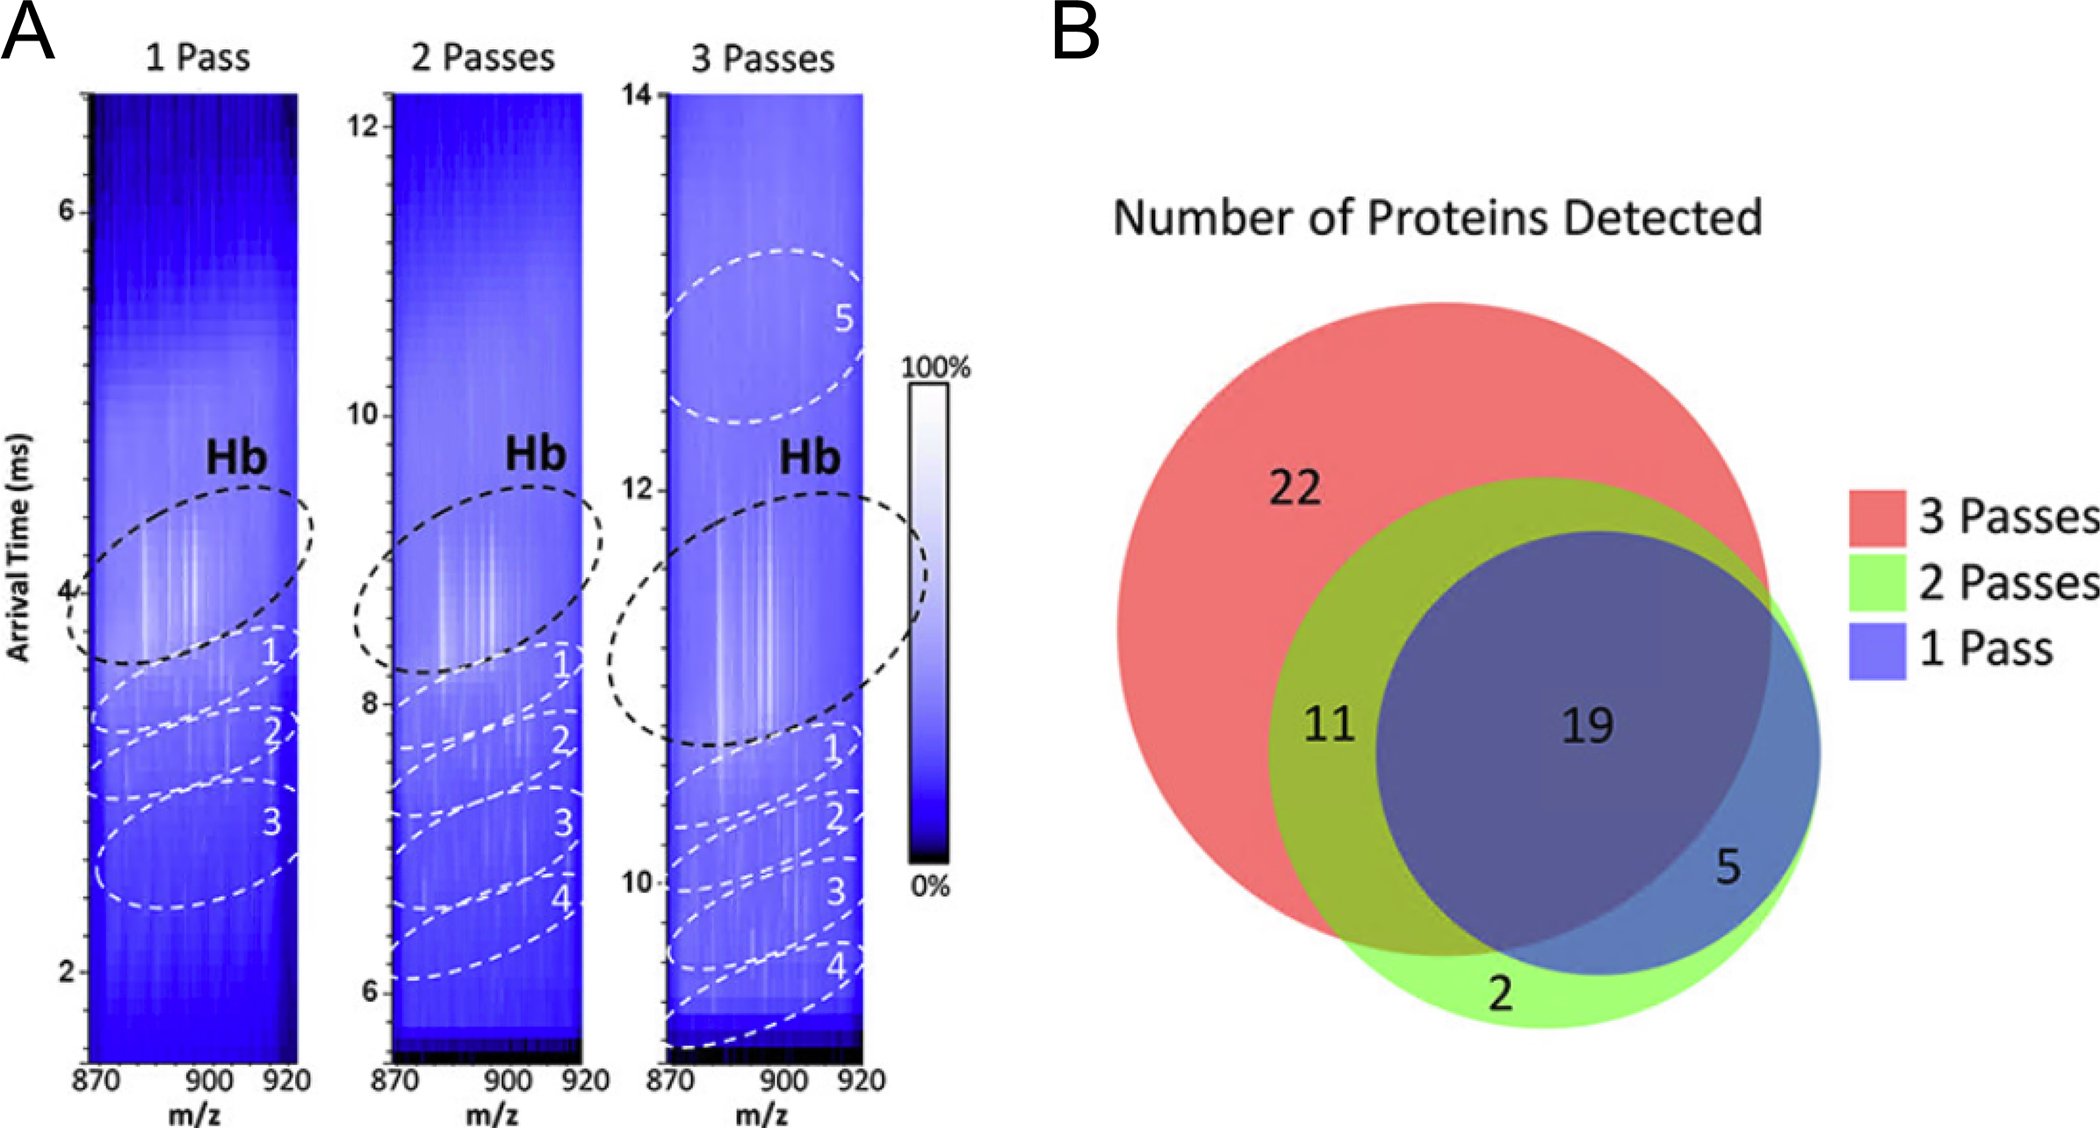
Figure 4:

Increasing passes of ions through the cTWIMS device results in higher degrees of separation and more proteins detected from a LESA experiment of murine kidney tissue. LESA experiments were performed with a microjunction diameter of ~1.5 mm and data were collected using a prototype cTWIMS-MS mass spectrometer with quadrupole isolation of m/z 870 – 920. (A) 2D heatmaps plotted with arrival time vs m/z for 1, 2, and 3 passes through the device with regions of interest circled. (B) Venn diagram of protein numbers detected for each number of cTWIMS passes. This figure is adapted with permission from ref48, Sisley, E.K. et al. Analytical Chemistry (2020). Copyright 2020 American Chemical Society.
