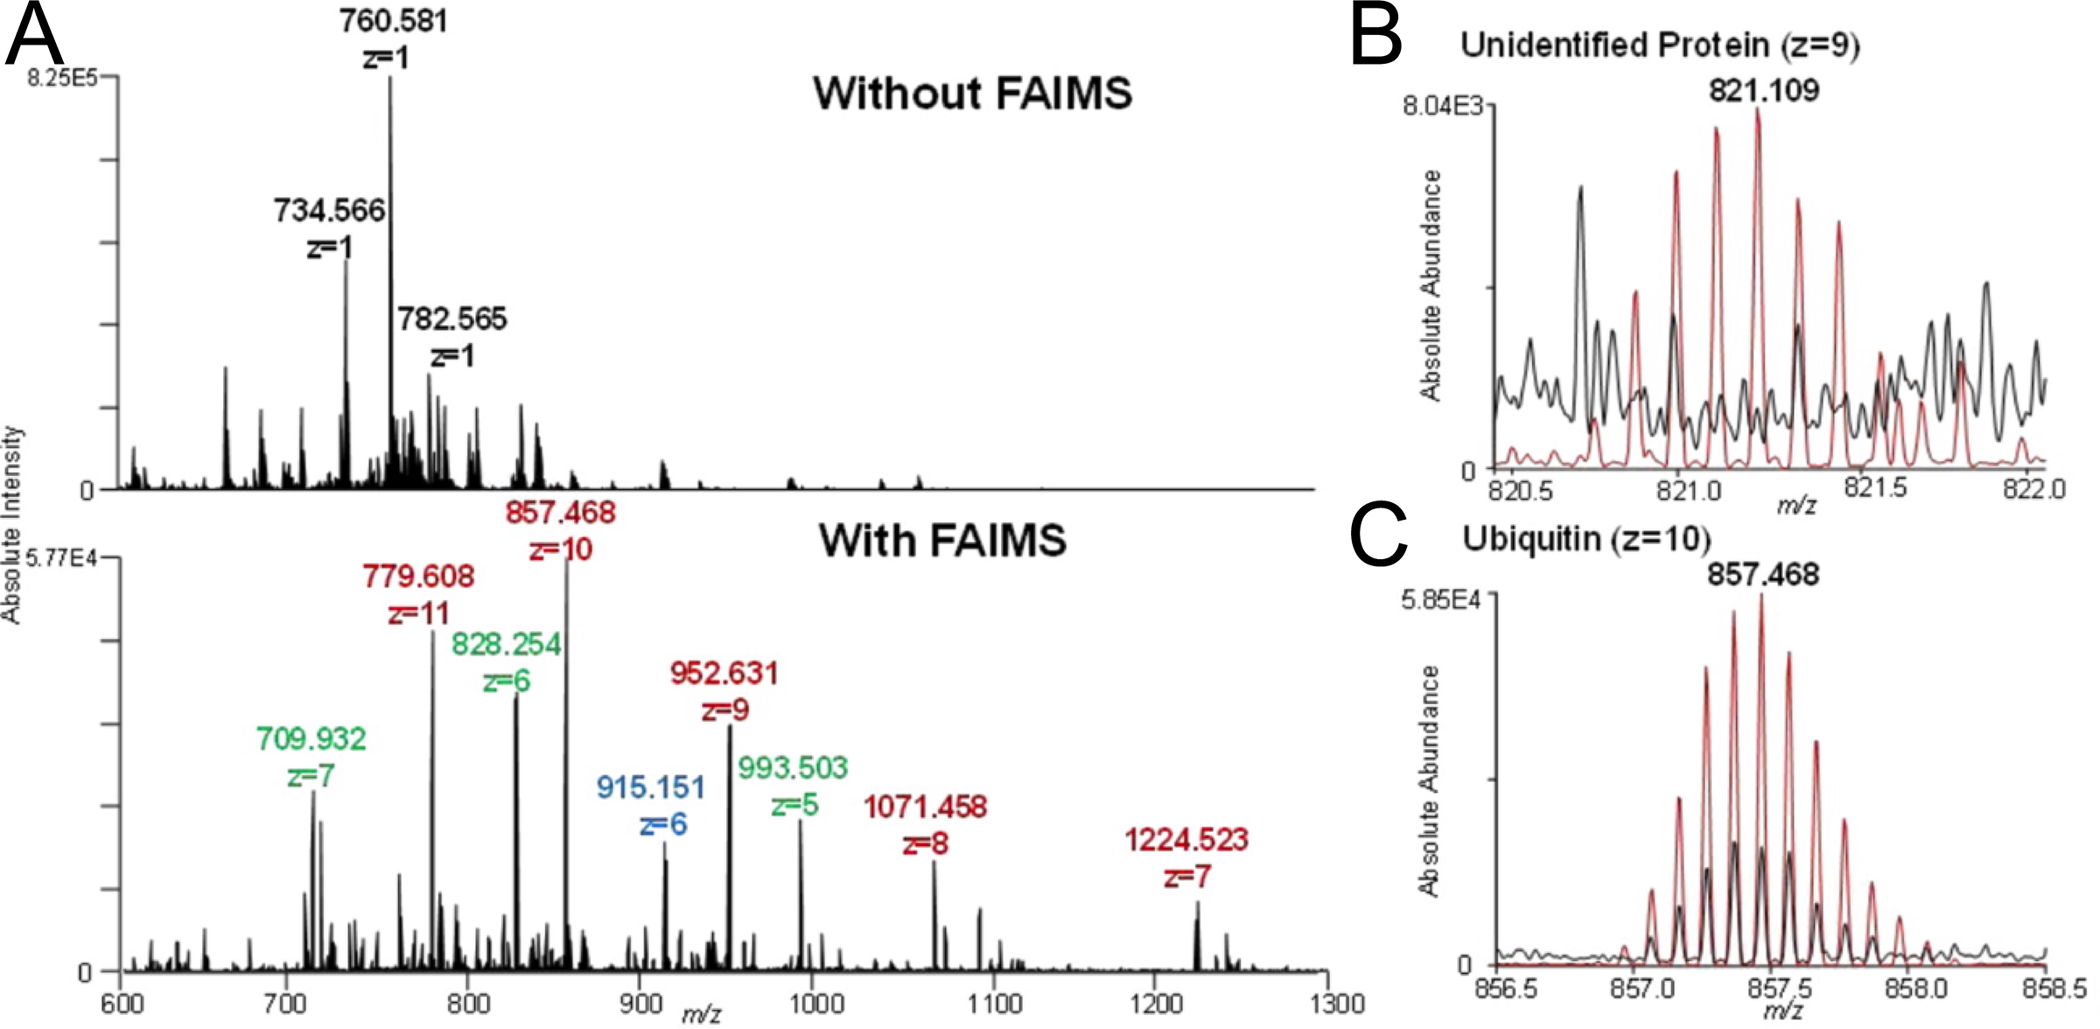
Figure 6:

LMJ-SSP analysis of rat brain tissue increases in S/N and number of proteins observed when FAIMS is applied. Data were collected using a Q Exactive mass spectrometer equipped with an ultraFAIMS device using an ND chip and optimized for proteins between 4 – 12 kDa. (A) Spectral interferences are significantly reduced with FAIMS. (B) Signal detected of an unidentified protein (z=9) with, (red) and without, (black) FAIMS. (C) Signal detected of a ubiquitin (z=10) with, (red) and without, (black) FAIMS. This figure is adapted with permission from ref49, Feider, C.L. et al. Analytical Chemistry (2016). Copyright 2016 American Chemical Society.
