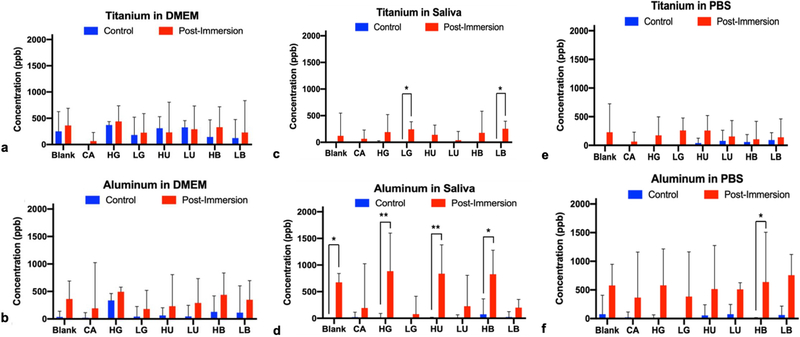
Fig. 4.
a-b Concentration of (a) Ti and (b) Al particles after immersion of Ti6Al4V disks in simulated diabetic (high solute concentration) or non-diabetic (low solute concentrations) for 28 days at 37 °C in various media (DMEM) using ICP-OES. Treatments were citric acid (CA) positive control, glucose in high (HG) and low (LG) concentrations, urea in high (HU) and low (LU) concentrations, beta-hydroxybutyrate in high (HB) and low (LB) concentrations, and the untreated blank control. Single asterisk denotes statistical significance (P < .0097), double asterisk denotes (P < .0001)
Fig. 4 c-d Concentration of (c) Ti and (d) Al particles after immersion of Ti6Al4V disks in simulated diabetic (high solute concentration) or non-diabetic (low solute concentrations) for 28 days at 37 °C in various media (artificial saliva) using ICP-OES. Treatments were citric acid (CA) positive control, glucose in high (HG) and low (LG) concentrations, urea in high (HU) and low (LU) concentrations, beta-hydroxybutyrate in high (HB) and low (LB) concentrations, and the untreated blank control. Single asterisk denotes statistical significance (P < .0097), double asterisk denotes (P< .0001)
Fig. 4 e-f Concentration of (e) Ti and (f) Al particles after immersion of Ti6Al4V disks in simulated diabetic (high solute concentration) or non-diabetic (low solute concentrations) for 28 days at 37 °C in various media (PBS) using ICP-OES. Treatments were citric acid (CA) positive control, glucose in high (HG) and low (LG) concentrations, urea in high (HU) and low (LU) concentrations, beta-hydroxybutyrate in high (HB) and low (LB) concentrations, and the untreated blank control. Single asterisk denotes statistical significance (P < .0097), double asterisk denotes (P < .0001)

