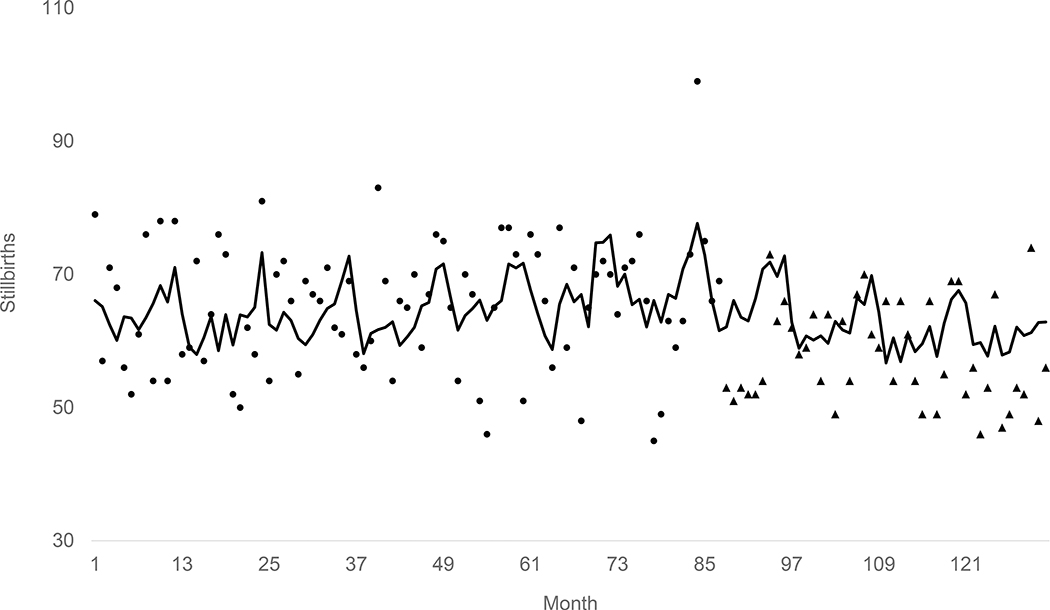
Figure 1.
Line shows expected (from population at risk and autocorrelation) stillbirths in the periviable period for cohorts conceived in California from January 2000 through December 2010. Points show observed stillbirths before April 2007. Triangles show observed stillbirths during and after April 2007.

