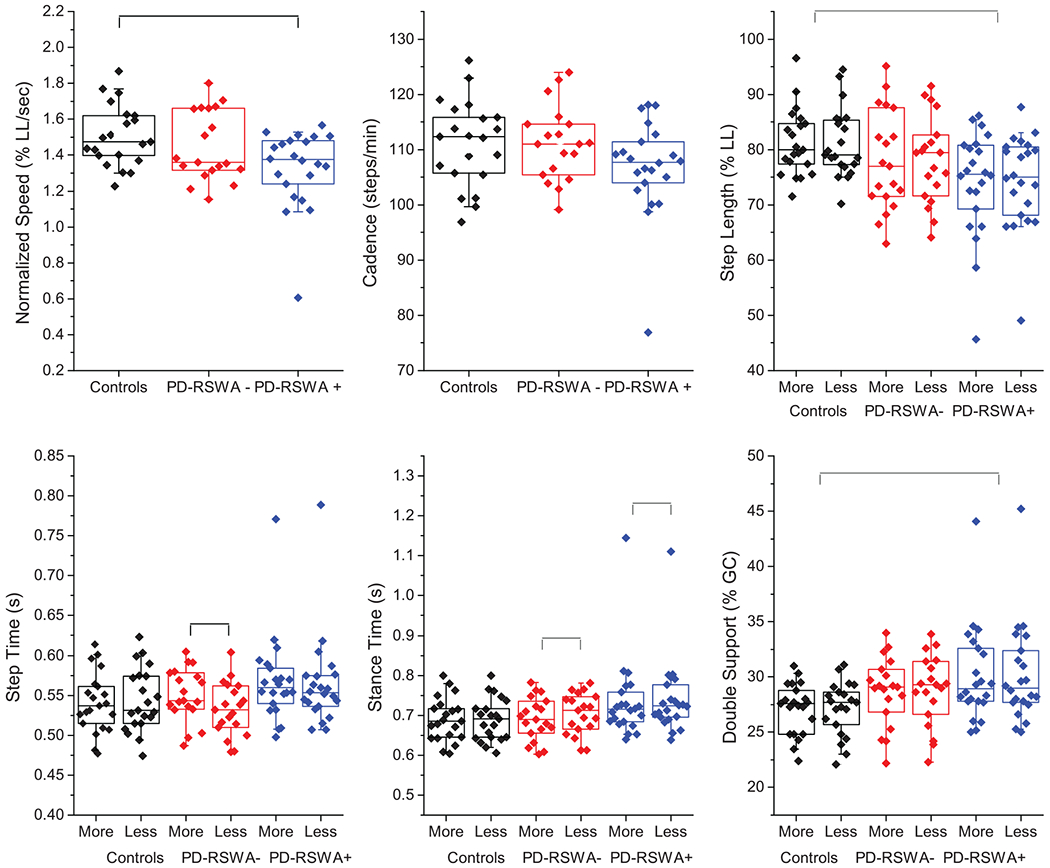
Fig. 1.

Box and whiskers plots demonstrating group differences in key gait measures including speed (normalized to percentage of leg length), cadence, step lengths (normalized to percentage of leg length), step time, stance time, and double support time (normalized to percentage of the gait cycle, %GC). Measures that involved separate legs were sorted according to more and less affected limb as determined by the MDS-UPDRS III motor exam. Those who were symmetrical were randomly assigned. The means of each individual subject’s data are overlaid on the box plots. Colors assigned to each group are: controls (black), PD-RSWA− (red), PD-RSWA+ (blue).
