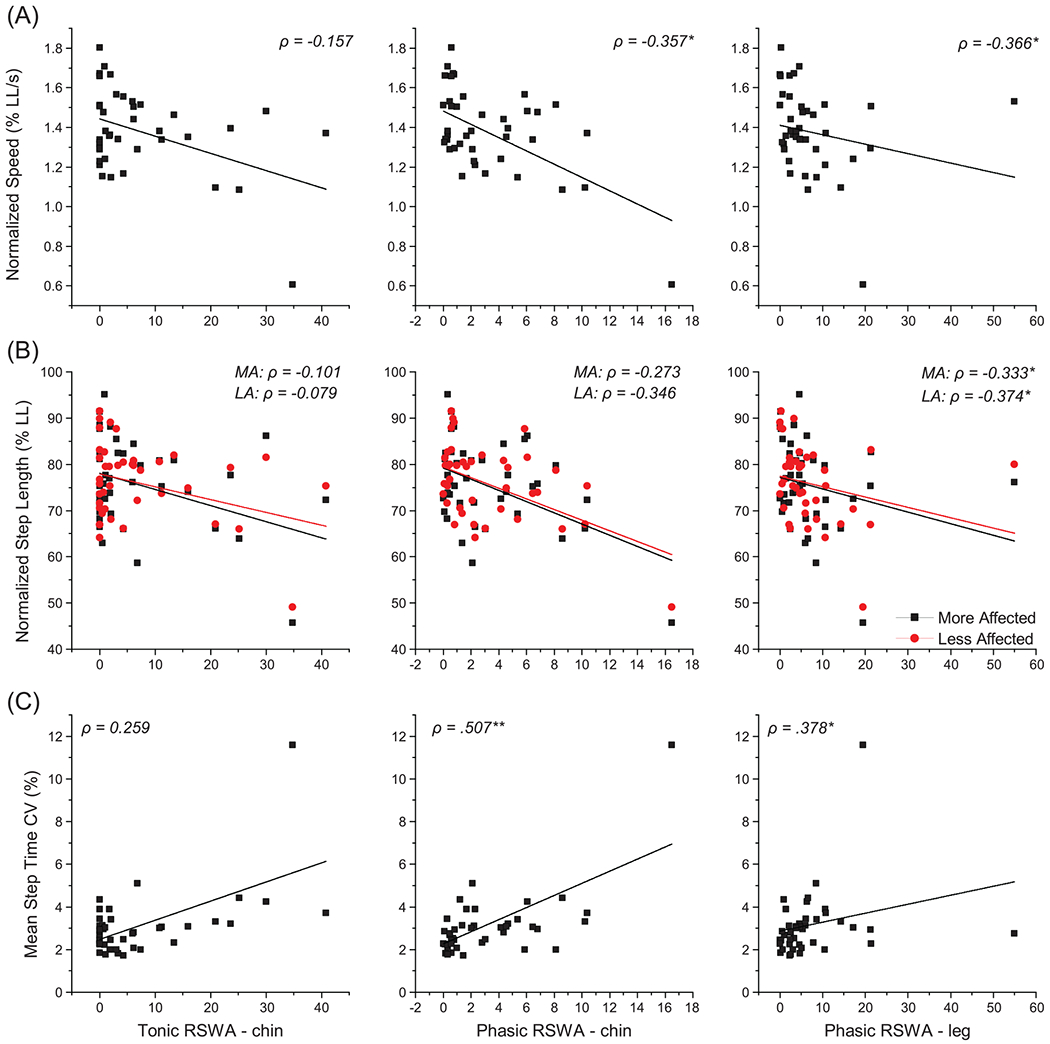
Fig. 2.

Correlations of gait measures to PSG RSWA scores within the participants with Parkinson’s disease (n = 41). The relationship of gait measures including (A) speed and (B) step length, both normalized to leg length, and (C) average step time coefficient of variation are plotted relating to tonic and phasic chin EMG activity and phasic leg EMG activity during REM sleep. Black squares represent the mean value for each participant on figures (A) and (C). On figure (B), black squares represent the mean of each participant’s more affected leg, while red circles represent the mean of each participant’s less affected leg. Lines are the lines of best fit for the data of matching color. *p < 0.05, **p < 0.01, ***p < 0.001.
