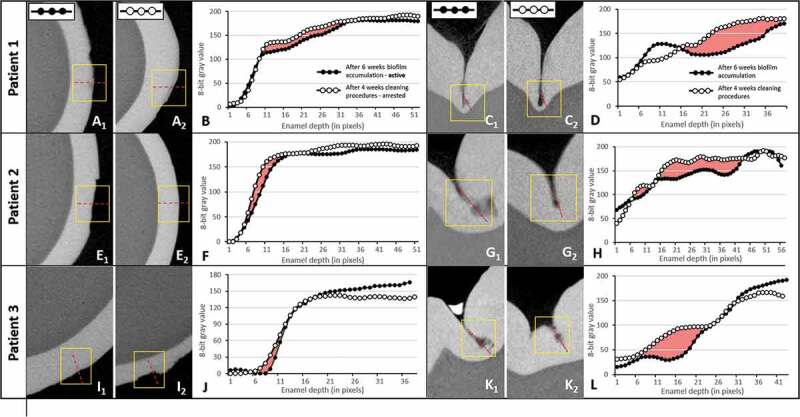
Figure 2.

Micro-CT analysis confirms caries lesion progression and arrest of the studied specimens in the in vivo model. (A, E, I) Micro-CT cross-sectional slices of teeth after 4 weeks of biofilm accumulation (1) or after 2 weeks of tooth cleaning procedures (2) in smooth (buccal) surfaces. (C, G, K) Micro-CT cross-sectional slices of teeth after 4 weeks of biofilm accumulation (1) or after 2 weeks of tooth cleaning procedures (2) in occlusal surfaces. (B, D, F, H, J, L) Density profile plots along dotted red lines in active and arrested caries specimens. Red areas indicate ΔZ (integrated mineral loss area)
