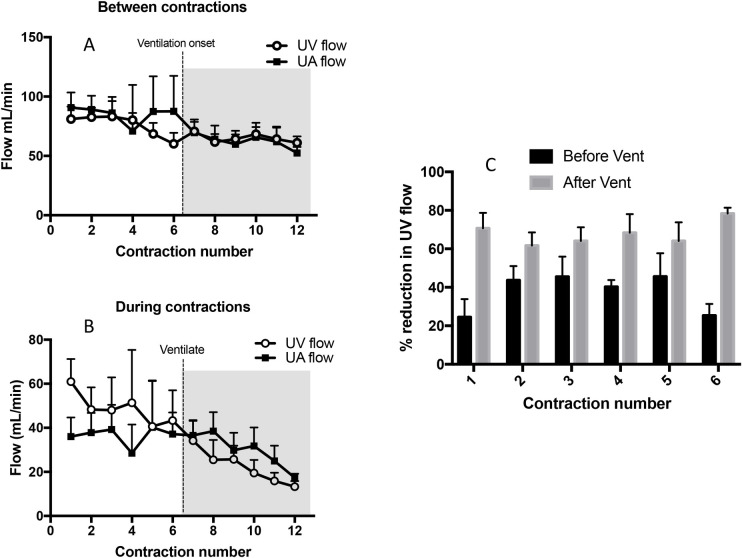
Fig 7.
Mean blood flows in the umbilical vein (UV; open circles) and umbilical artery (UA; closed squares) measured immediately before (A) and during (B) consecutive uterine contractions before and after ventilation onset. Both UV and UA flow significantly decreased with increasing contraction number during (p<0.0001 and p = 0.015, respectively) between (p = 0.0001 and p = 0.001, respectively) contractions (C) The percentage reduction in UV flow during a uterine contraction was significantly greater (p<0.0001) after ventilation onset (grey bar) compared to before ventilation onset (black bar).

