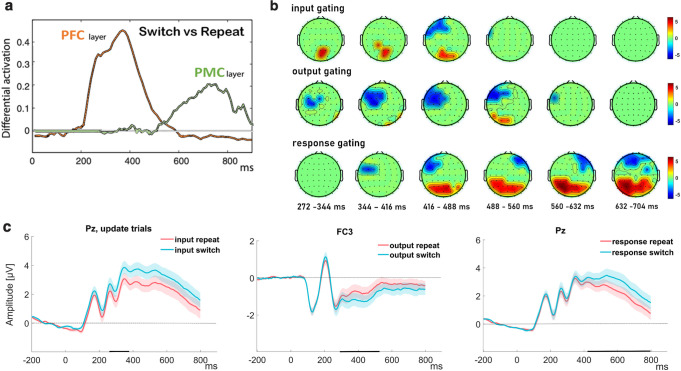
Fig 4.
(a) Summed activation over units in PFC-BG neural network, showing impact of gate switch vs repeat early in PFC and later in motor cortex (adapted from [62]). (b-c) Current study. (b) Scalp map topography for the predictors that survived permutation correction for the three gating types (input in updating trials, output, response in three rows from top to bottom). The color in the scalp map represent the t-value of the average regression weights in each electrode at the time range indicated above each scalp map. Input, output and response gating signatures evolve sequentially in time, but with clear temporal overlap. (c) Grand ERP plots at representative electrodes from the significant univariate patterns show significant and dissociable effects for switching during input, output and response gating. The shaded error bars represent standard error of the mean (SEM) and the black markers on the x-axis reflect the time points where the difference between switch and repeat was significant.

