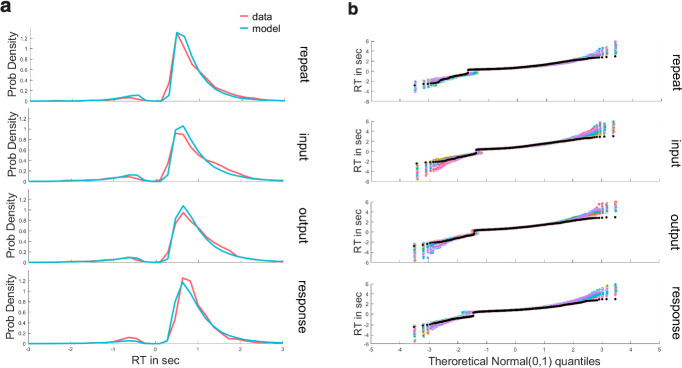
Fig 6. Model fit.
(a) Behavioral RT distributions across the group are shown for switching at each level (red line) together with posterior predictive simulation from the HDDM (light blue) in updating trials. Distributions of correct (the right positive tail) and incorrect (left negative tail) trials show good correspondence between data and model. (b) Model fit with Quantile-Quantile plots. Model fit to behavior can be more precisely viewed using quantile-quantile plots, showing quantiles of the empirical behavioral RT distributions (black) against the 50 simulation of RT distribution (colored lines, capturing model uncertainty) from the posterior predictive of the HDDM model, for correct response (positive RT) and incorrect responses (negative RT) in updating trials. Quantiles were computed at the group level. The empirical RT was mostly within the range of the simulated RT with a small over-estimation at the right tail of the distribution.

